
If you're in digital marketing, building a smart measurement plan is key to long-term success. With new platforms popping up, privacy rules evolving, and an overwhelming number of metrics to track, it’s easy to feel buried in data. But instead of chasing every stat, let’s focus on the ones that truly move the needle. This guide will help you streamline your measurement approach, zero in on what matters most, and build a strategy that grows with you.
Measurement is often overlooked and is only considered after a campaign has concluded. I strongly believe this mindset needs to change, and marketers need to incorporate marketing measurement into the planning stage of any campaign.
How to Build a Strategic Marketing Measurement Plan
No one builds a house without a blueprint. Before diving into tools or dashboards, let’s get clear on what you want to learn and why it matters.
- What are you measuring?
- Who are you reporting to?
- What decisions will the data drive?
A strong measurement plan starts with strategy, not software. Think of it like building your playbook before the season begins. You're setting the tone for every move your team will make. Your strategy should include plans for any reasonable outcome:
- What will you do if your campaign falls flat out of the gate?
- What if it overperforms?
- What are the “tripwires” for changing course mid-campaign?
Starting with a plan ensures you’re marketing with intention, so you’re not just reacting when things go off the rails. If you’re continuously reacting to the data, you’ll never have that “aha” moment to make the campaign successful.
Can you run your campaigns based on reactive behavior? Absolutely! But does your mental health really need that constant rat race? Probably not. If you're the one wearing every hat, the last thing you need is data-induced burnout.
Answering measurement questions before starting a campaign
Getting the entire team, leadership, or board on the same page before the campaign goes live will help set expectations for you as the measurer. Here are the questions you should be asking, and a potential answer for each:
- What platform are you using for the campaign: Meta Ads
- What type of campaign are you running: Traffic campaign
- What is the campaign goal: Link clicks to the website*
- Who are you reporting to: Leadership team
- What decisions will the data drive: how to optimize the landing page for more conversions
*This is the most important question to answer. As many who don’t understand the digital marketing landscape will question, “Why aren’t we getting leads?”
Use the Right Tools, Not More Tools
You don’t need more analytic tools, just the right ones working together. GA4, Google Tag Manager, Google Ads, and Looker Studio are core to accurate tracking and reporting. Add Microsoft Clarity for visual insights into user behavior. These tools are your training equipment, reliable (more or less 😅), purpose-driven, and designed to deliver results when used well.
But here’s the catch: while nearly every marketer we surveyed had GA4 installed (92%), very few felt confident in what they were seeing. In fact, one responder said, “GA4 is thorough but requires expertise to navigate and understand.” When you set up GA4 “out of the box”, it’s helpful to an extent. The more you continue to evolve your skills with Google Tag Manager, the more powerful your GA4 property can be.
Most teams aren’t using the tools needed to turn raw data into actionable strategy. The result? GA4 is running quietly in the background while marketers are still making decisions blindly. If you know what you’re looking for and how it’s measured, GA4 isn’t the big bad wolf in this data story; it’s the huntsman coming to save the day.
Focus on Meaningful Engagement Metrics
van•i•ty met•rics | n.
- superficial measurements that can make a business look good on the surface but don't indicate real progress or success
- numbers you brag about in meetings while quietly hoping no one asks what they actually mean
- data points that inflate your ego but not your revenue
Forget vanity metrics. The real question is: are your users engaging with your site? Are they staying, clicking, and converting? Our engagement metrics should reflect the quality of interaction, not just the quantity of visits. Don’t just track who showed up, track who stayed and took the desired action you planned for at the site.
From our survey, we saw that most teams are still stuck in “basic reporting” mode, if not worse. Some even admitted they weren’t sure if anyone was looking at the reports at all!
One issue is that the typical analytics dashboard is built with an overwhelming amount of numbers, charts, scorecards, and so on, bloated with unimportant vanity metrics.
Another problem is that a dashboard is useless if no one believes the numbers on it, and right now, most teams are second-guessing their data, or worse, pretending it makes sense. This often happens when the report data being provided tells the wrong story.
When trust breaks down, so does decision-making. Without confidence in your reporting, you’re not optimizing your marketing, you’re just hoping for the best.
Map the Customer Journey
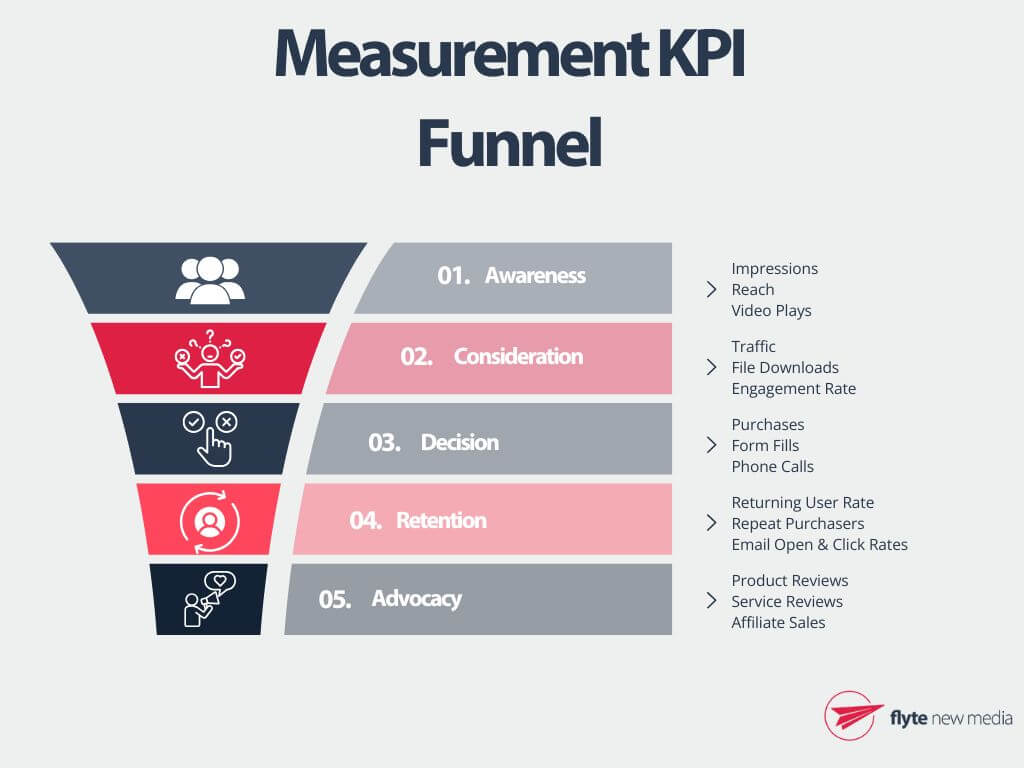
Good measurement tells you more than what happened, it shows when and why it happened. To achieve that goal, you’ll need to map your customer journey across Awareness, Consideration, and Decision stages, then align your metrics to each phase to better understand performance.
Understanding which metrics to track at every phase helps your entire organization understand the “why” and “how” of the campaign being run.
Metrics to Measure by Customer Journey Step
In our survey, marketers expressed frustration over missing events and broken paths. Without a clean funnel or proper tagging, answering basic questions—like “Did this work?”—becomes guesswork. The data might exist, but without a marketer scouring over the data every month, it becomes harder and harder to spot the trends and patterns.
Make Analytics Optimization a Habit
Measurement isn’t a set-it-and-forget-it task. Use the insights you gather to continually test and refine your campaigns. Ongoing optimization should be baked into your plan, not tacked on later.
As you optimize, use forecasts and expectations to set goals. Then compare those goals to real outcomes. This lets you identify what’s working and where adjustments are needed. It also allows you to communicate effectively with your management team on how the campaign did. You should never leave management in the dark before, during, or after a campaign; getting their buy-in is crucial to the lifecycle of media campaigns.
Our research uncovered another critical gap: teams are creating reports, but they’re not using them to steer the strategy. Copying metrics into spreadsheets isn’t enough, you need a process that translates stats into plays. Too often, marketers feel stuck maintaining dashboards that don’t help them win.
Data Visualization for Smarter Decisions
Spreadsheets have their place, but when it comes to fast, confident decision-making, static rows and columns often fall short. That’s where visualization tools like Looker Studio come in. Instead of sifting through endless tabs of raw data, you get clear, automated dashboards that bring your key metrics to life.
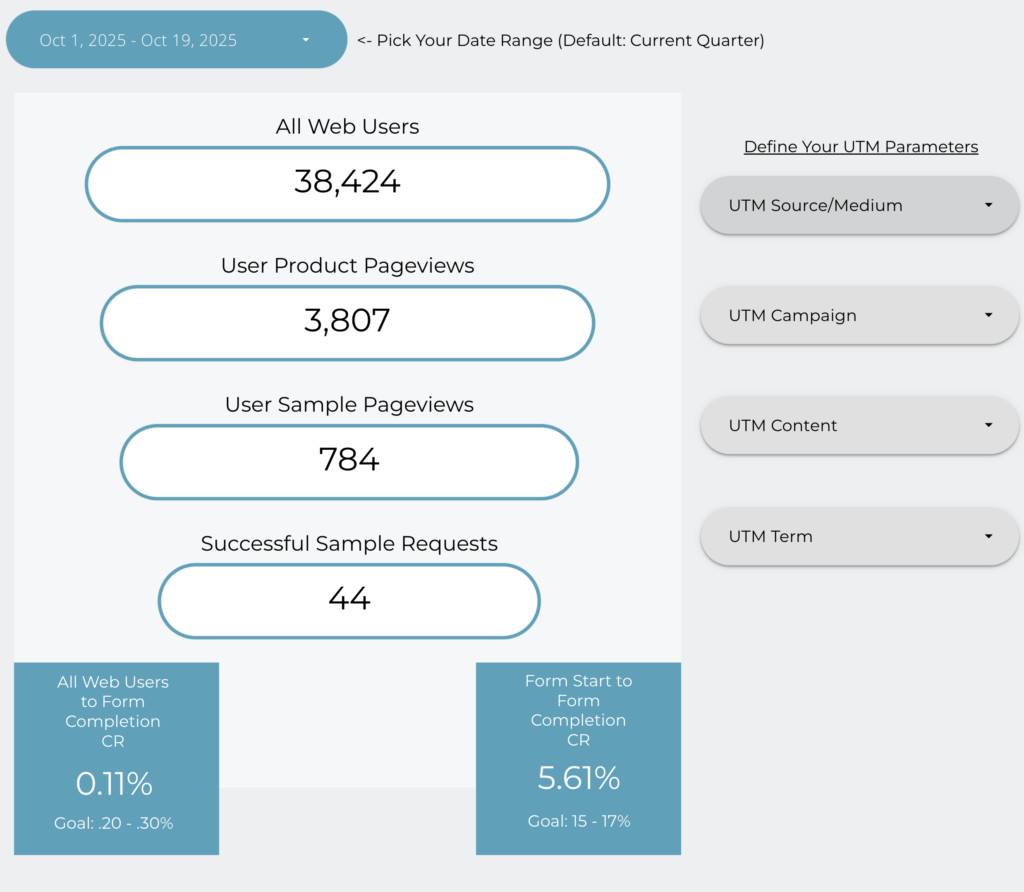
With a well-designed dashboard, you can instantly spot performance trends, diagnose bottlenecks, and pinpoint opportunities.
- Are your conversions up after a recent campaign tweak?
- Is one traffic source consistently underperforming?
- Are there daily or weekly trends that might impact ad spend?
These insights should stand out to you, rather than requiring a deep dive. Visualizations give you that quick-glance intelligence you need to make sharp calls under pressure.
What Makes a Marketing Measurement Plan Effective?
You don’t need to track everything, just the right things…that’s why they call them Key Performance Indicators (KPIs). From our work with clients across a wide variety of industries, we’ve found that successful plans share a few core traits:
- KPIs that tie directly to business goals
- Streamlined reporting with tools like GA4 and Looker Studio
- A consistent cycle of strategy, setup, and ongoing optimization
Whether you're reviewing campaign performance or refining broader marketing metrics, the goal is always clarity. Measurement marketing is about having the right tools, questions, and mindset to move forward with confidence.
Let’s Get You the Data You Need for Better Decision Making
Ready to simplify your data and grow with clarity? Book a measurement check-up with flyte today. It’s time to take control of your measurement strategy and report with confidence!
Want to see how you measure up against our analytics survey respondents? Or get more insight into how others are measuring campaign success? Download the full report now!

John comes to the flyte new media team with a motivation to help clients grow their business and online presence. He brings a lot of enthusiasm and a positive attitude to flyte’s marketing department. He is Google Analytics and Google Ads certified which is where his true work passion lies, SEO, Local SEO, and paid search. He can be kind of a data nerd but that’s never a bad thing.
An avid sports fan, a day doesn’t go by where John doesn’t catch that game, that score, or that highlight play. He continuously joins way too many fantasy sports leagues but don’t worry, his win percentage is still very high. John can also be found adventuring with his wife, their daughter, and Goldendoodle, Harper Lee.