
When you’ve been managing Google Ads long enough, the basic metrics start feeling like the dashboard of a car. CTR (click-through-rate), CPC (cost-per-click), and conversions tell you how fast you’re moving, but they don’t always explain why the ride feels smooth one day and bumpy the next.
Once you’re past the beginner stage, you need more than speedometer-level insight. You need to know what’s happening under the hood, how much fuel you're burning, and whether you’re even driving on the right stretch of road.
That’s where the lesser-known metrics come in. They help you understand where your campaigns are thriving, where you’re leaking efficiency, and how to tune things up so you can get farther on the same tank.
What are the best hidden Google Ads metrics?
Here are five underrated PPC metrics that reveal campaign health and performance:
- Impression Share & Lost Impression Share
- Top of Page Rate & Absolute Top of Page Rate
- CPA vs. Conversion Value
- View-Through Conversions
- Search Absolute Top Impression Share
1. Impression Share (IS) and Lost Impression Share (Budget or Rank)
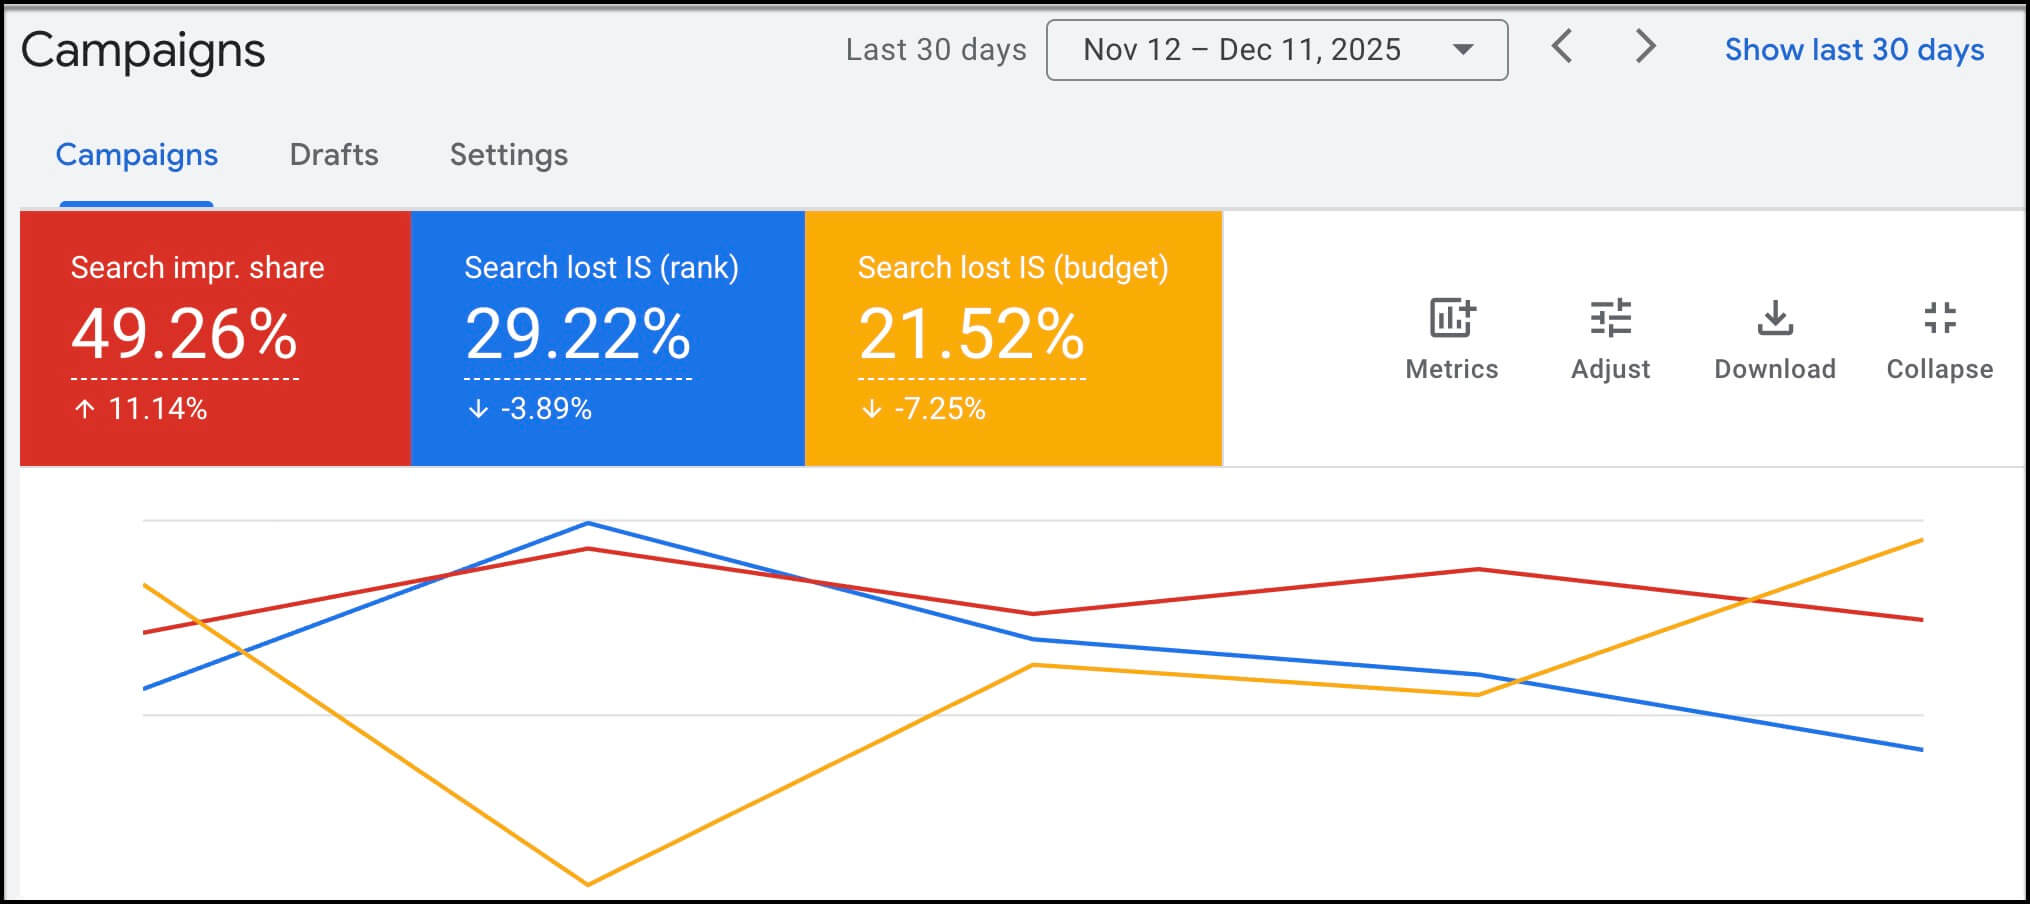
Impression Share is the share of the road your ads actually got to drive compared to the full stretch they could have traveled. It shows the percentage of impressions you received out of all the impressions you were eligible to receive.
Eligible impressions = every auction where Google would have shown your ad if:
- Your budget was enough
- Your ad rank was strong
- Your targeting matched
- Your ad and landing page met performance thresholds
So Impression Share doesn’t tell you how many people searched something in total, it tells you how many auction opportunities Google allowed you into and how many of those you didn’t miss.
Lost Impression Share (Budget)
Lost IS (Budget) shows how often your ads would have shown if your fuel tank didn’t run dry. It means your daily budget couldn’t cover all the impressions you were eligible for.
Real-world example: there were 1,000 highway miles you could have driven today. You only had gas for 600. The missing 400 came from a budget-limited tank.
Lost Impression Share (Rank)
Lost IS (Rank) is different. This isn’t a fuel problem — it’s a horsepower issue. Your budget’s fine, but your ad simply isn’t powerful enough to outrun competitors.
High Lost IS (Rank) often ties back to:
- Low bids
- Lower CTR
- Less relevant ads
- Underperforming landing pages
What These Metrics Reveal
- High IS + Low Conversions: You’re showing often, but not moving people to act. Maybe the road is right, but the destination isn’t appealing.
- Low IS + High Conversions: Great efficiency with room to scale once budget or rank is improved.
How to Use Them Together
- Fix Lost IS (Budget) by increasing your budget, but only if your CPA is stable.
- Fix Lost IS (Rank) by improving ad relevance, tightening keyword alignment, or optimizing landing pages before increasing bids.
Takeaway: Impression Share tells you where you could have shown up. Lost IS reveals where you fell short and how to fix it.
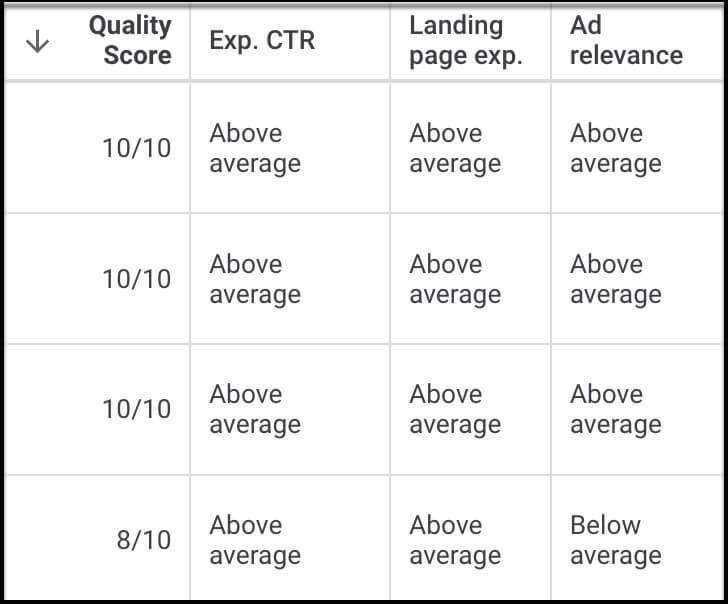
Bonus Tool: Use Quality Score diagnostics to understand why your rank may be slipping.
Google gives every keyword a Quality Score made up of three components:
- Expected CTR – how likely Google thinks people will click
- Ad relevance – how closely your ad matches the keyword
- Landing page experience – how useful and relevant the page is
When you click into a keyword in Google Ads and hover over its status (or look in the Quality Score columns), you’ll see each component labeled as:
- Above average
- Average
- Below average
Those labels are the Quality Score diagnostics.
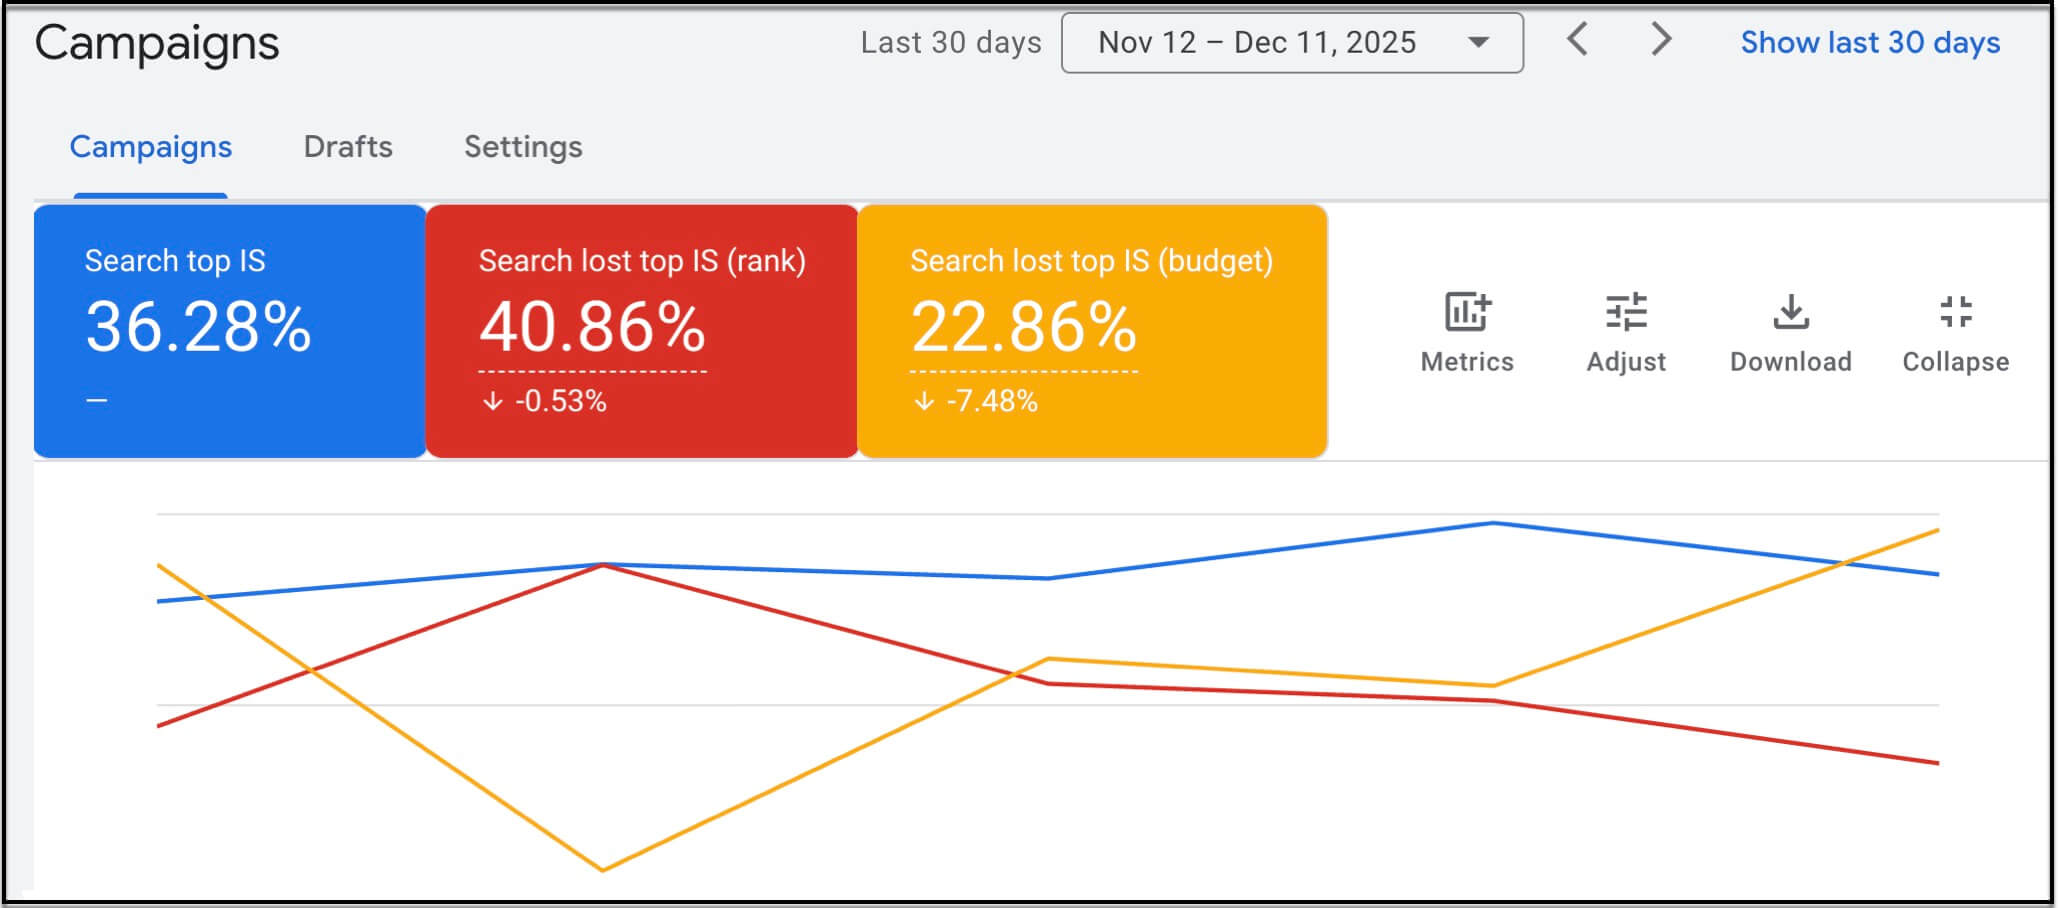
2. Top of Page Rate and Absolute Top of Page Rate
When Google retired Average Position, these became the new markers for how visible you are on the results page.
- Top of Page Rate: How often your ad appears anywhere above the organic listings.
- Absolute Top of Page Rate: How often your ad lands in the coveted first position.
What These Metrics Reveal
- Low Top of Page Rate: Bids aren’t competitive or relevance is low.
- High Absolute Top Rate + Low Conversions: You’re paying premium tolls for a scenic view that isn’t converting.
How to Combine Them
- Top of Page Rate + Conversion Rate: High visibility but low conversions? You might be attracting the wrong traffic.
- Top Rates + CPA: If CPA climbs as position improves, you may be overpaying.
Bonus Tool: Use Auction Insights to see how aggressive your competition is.
Takeaway: High visibility doesn’t always equal high performance. Balance position and payoff.
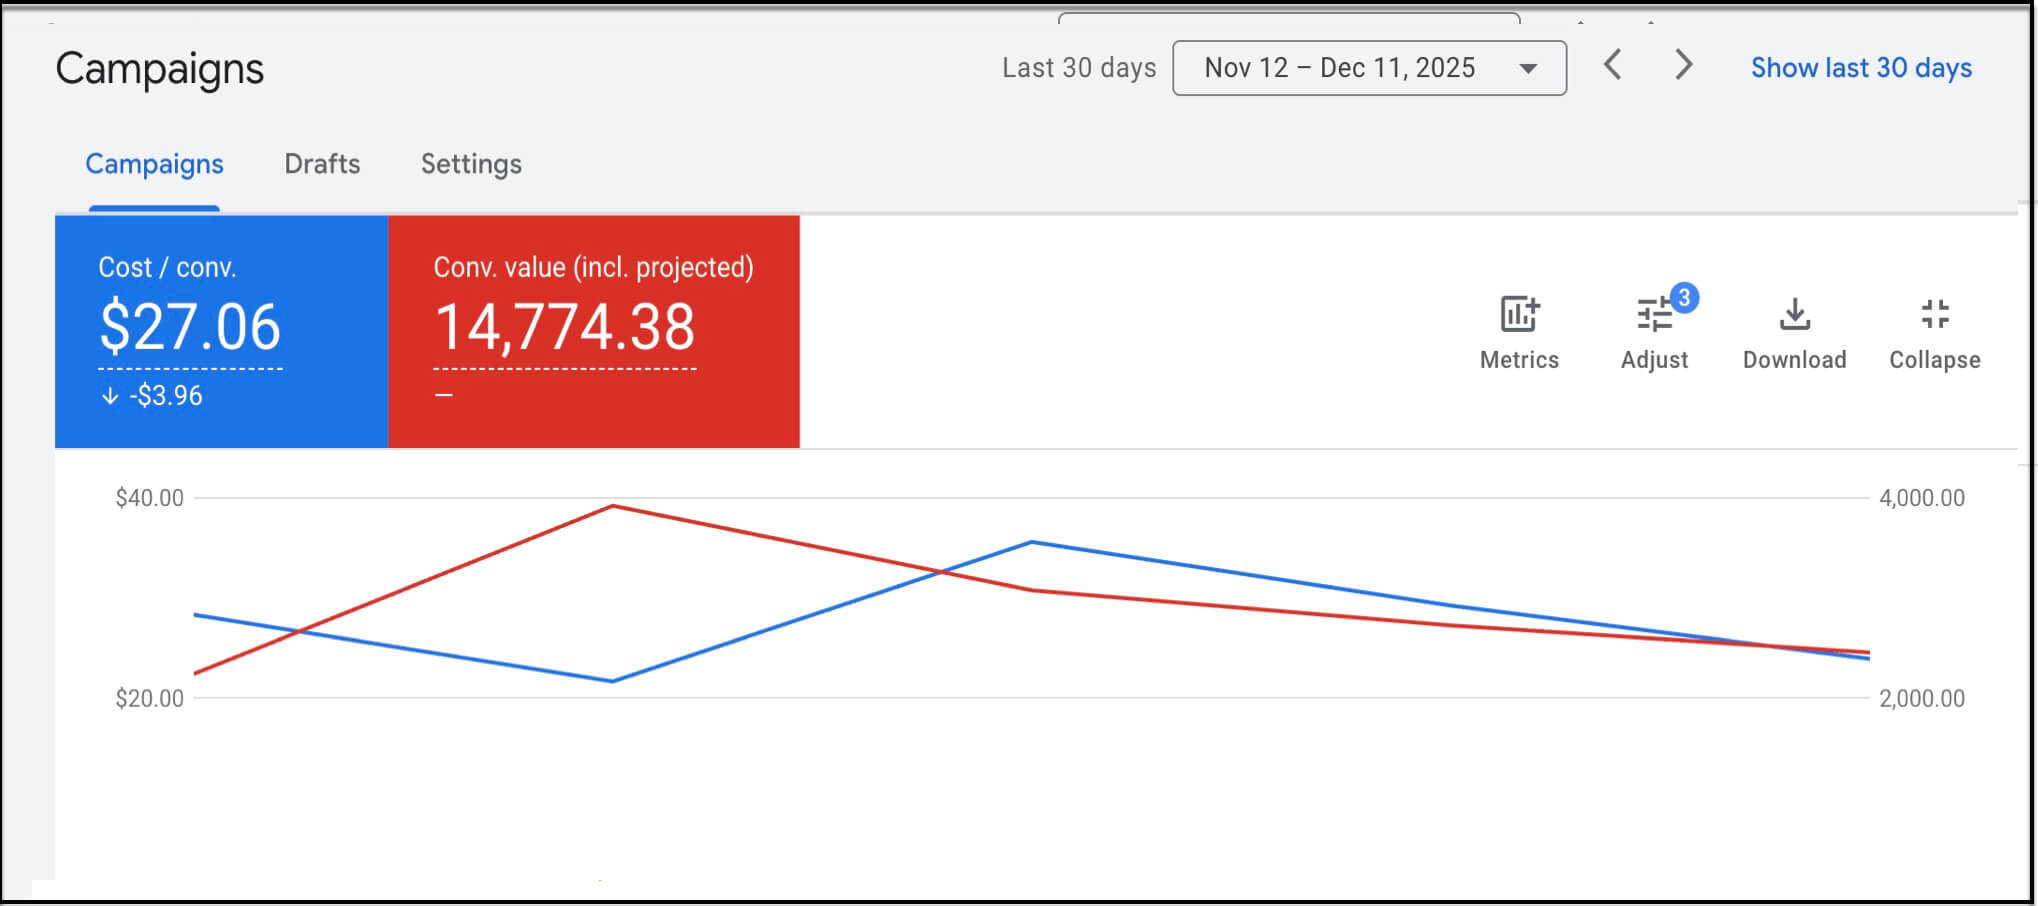
3. Cost/Conversion vs. Conversion Value and Why ROAS (return on ad spend) Should Join the Conversation
Cost/Conversion tells you what it costs to pick someone up. Conversion Value tells you how much that person is worth once they’re on board.
Key Scenarios
- High CPA + High Conversion Value: Expensive but profitable.
- High CPA + Low Conversion Value: A mismatch that needs a strategy overhaul.
How to Combine Them
- If CPA > Conversion Value, you’re losing money.
- Use CPA + ROAS for better context on revenue per dollar spent.
Pro Tip: Even if you're not ready for value-based bidding (when you assign a dollar value to your conversions and let Google optimize toward the highest total value, not just the highest number of conversions), assign values to different lead types or funnel steps to give Google better signals.
Takeaway: Combining CPA, Conversion Value, and ROAS tells you if your campaigns are not just converting, but converting profitably.
4. View-Through Conversions (VTC)
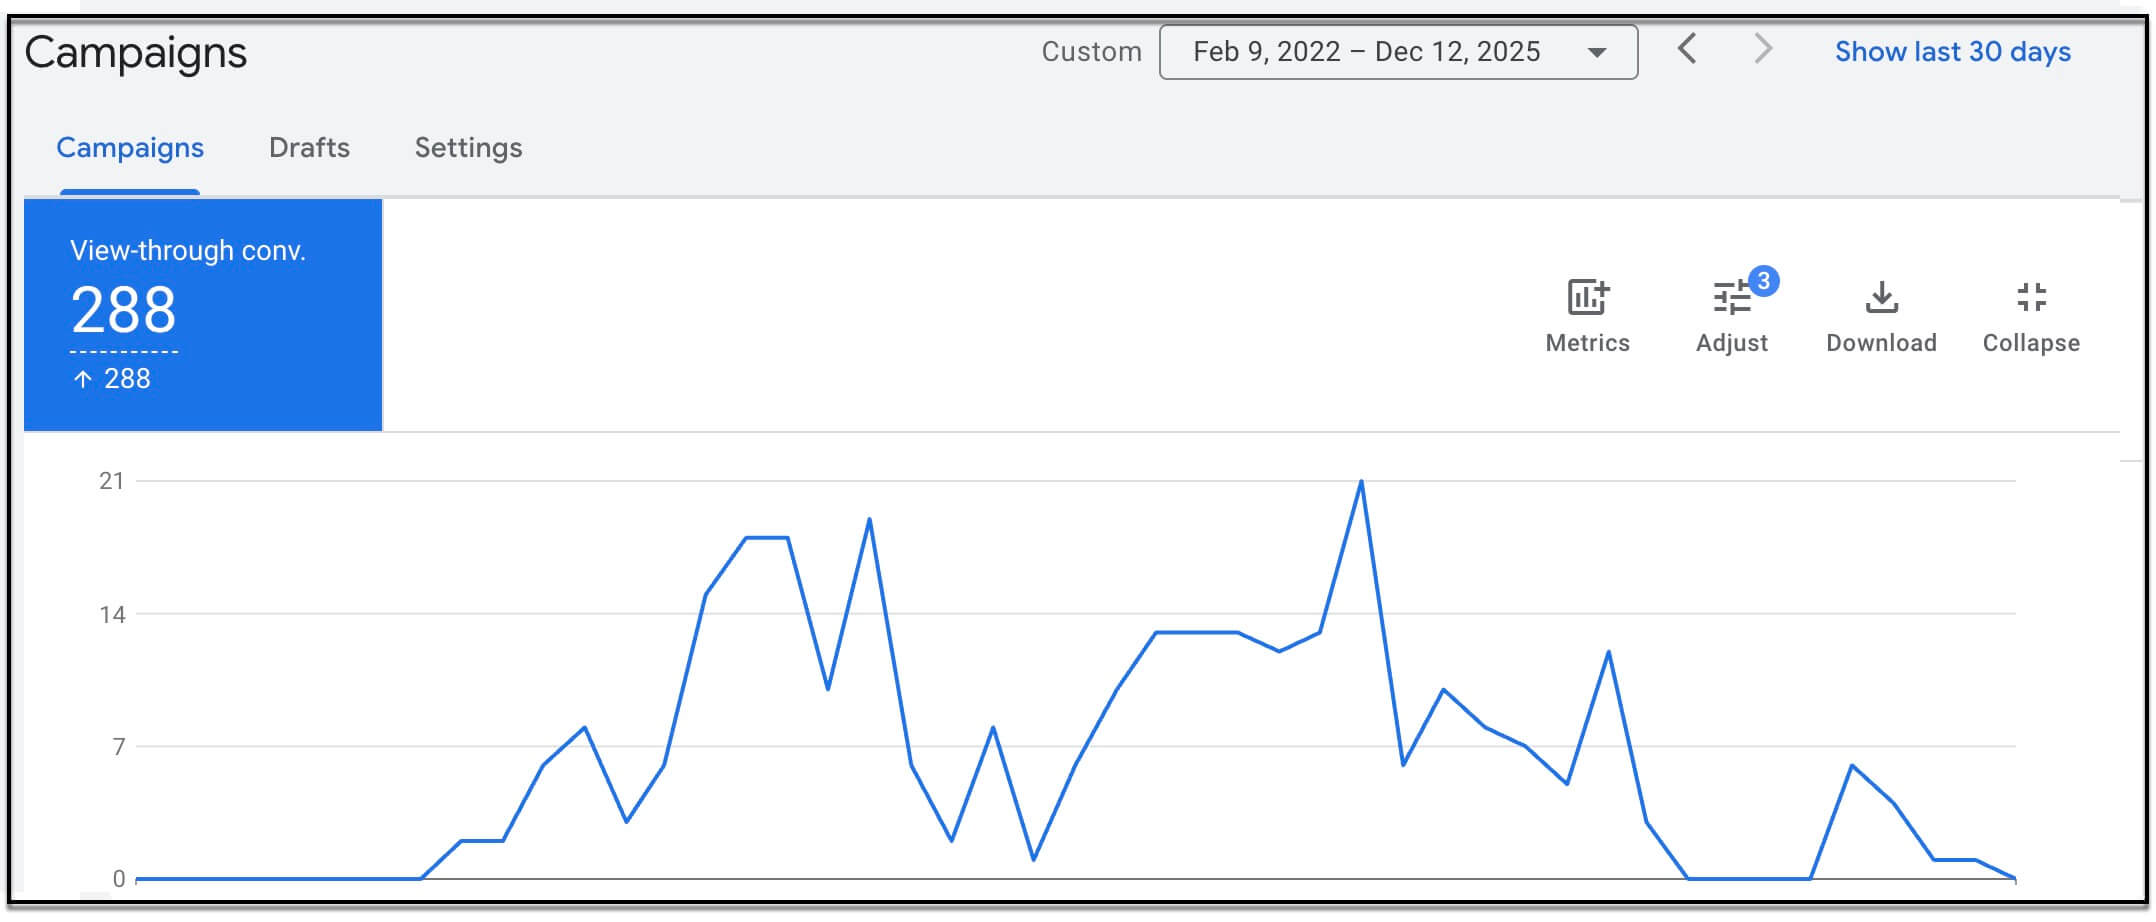
View-through conversions happen when someone sees your ad, doesn’t click, but converts later. Think of them like road signs on a highway — not acted on immediately, but influential.
What This Metric Tells You
- High VTC + Low CTR: Strong awareness, weak immediate action.
- High VTC + Low Direct Conversions: You’re influencing, but your creative might need stronger CTAs.
How to Combine
- Pair VTCs with assisted conversions.
- Analyze path length and time lag to understand buyer behavior.
Takeaway: Even if people don’t click right away, your ad may still be driving action later — don’t underestimate its influence.
5. Search Absolute Top Impression Share
This metric shows how often you claim the number one spot when eligible.
What This Metric Reveals
- Low Absolute Top IS: You’re not winning top placement.
- High Absolute Top IS + High CPA: You’re paying a premium that may not be worth it.
How to Combine
- Absolute Top IS + Conversion Rate: High placement but low conversions? Intent might be off.
- Absolute Top IS + CPA: Determine if the top spot is strategic or just bragging rights.
Pro Tip: Break this down by device. Phones have fewer ad slots, so top placement carries more weight.
Takeaway: The top spot may look good, but make sure it’s actually driving results.
Additional Supporting Metrics Worth Checking
- Search Terms Insights to validate keyword intent
- Audience performance across demographic or in-market segments
- RSA asset performance to see what messaging lands
Putting It All Together
Google Ads optimization isn’t about chasing a single number. It’s about reading the whole dashboard and knowing whether the engine, the fuel, the tires, or the route is responsible for your best or worst days.
Example:
- Clicks drop
- CTR rises
- Conversion rate improves
- Lost IS (Budget) climbs
This tells you: better traffic is coming in, but your campaign is running out of fuel too early. If CPA stays stable, increasing budget lets you capture more of the right traffic.
Final Thoughts
Metrics like CTR and CPC are important, but they only tell you how fast the car is moving. To really understand your campaign, you need the gauges that show fuel efficiency, engine power, road conditions, and who else is driving alongside you.
When you combine Impression Share, Lost IS, Top of Page metrics, VTCs, Click Share, and Auction Insights, you get the full view of what’s happening.
And once you see the road clearly, your optimizations stop being guesswork and start becoming strategic choices that get you farther, faster, and with a lot fewer unnecessary pit stops.
Want help making sense of your metrics? Let’s chat about how we can help you optimize your Google Ads strategy for real results.

Rachel was born and raised in southern NH, and became an official Mainer in 2016. With an academic background in psychology, she brings to flyte a passion for people and a fascination with what motivates them. This, combined with her artistic skillset, made the decision to pursue a career in marketing a no-brainer.
With a big sense of humor and sentimental nature, she becomes the “morale booster” of whatever group she’s in.
Outside flyte Rachel can usually be found doodling in her sketchbook, doing spot-on impressions (if she does say so herself), or binging the latest Netflix competition show.