
One of the more powerful features of GA4–Google Analytics 4–is the ability to create custom reports which help you get better information out of your website analytics. If you’ve been staring at your own GA4 account and not sure how to make heads or tails of it, or wondering what all the ruckus is about, this article will get you started with four powerful reports that will give you better insight into how your website visitors are finding and using your website.
I cut my teeth on Universal Analytics–what we used to call Google Analytics–so like most people I wasn’t thrilled when Google announced that it was going away. Sure, they promised a shinier, more robust tool to replace it, but change can be scary, right?
I’ve been deeply immersed in GA4 (Google Analytics 4) for over a year now, watching this new website traffic reporting tool evolve, optimizing it for our clients, creating custom reports, and I can say that there’s a lot for a marketer who likes data to get excited about.
Universal Analytics was very inflexible in how it operated. You got the reports that Google chose for you based on information about your business, and it was hard to get out of that box. Sure, they offered you “Custom Dashboards”, but how customized were they really? They also offered tutorials for their other tools like Google Looker Studio (formally Google Data Studio). That’s all well and good, but what if you just don’t have time to invest time into another Google product to extract the data you really need?
Now, GA4 gives you the ability to create a library of reports that are specific to your needs! Below, I’ve outlined 5 reports that you can build either into your library or within an Exploration.
1. Unassigned Data Report
One of the biggest differences that most people notice is the “Unassigned” data category within their Traffic (or User) Acquisition report. However, before creating a report, we need to understand what Unassigned traffic actually is.
What is Unassigned Data?
In the realm of channel grouping–the categories that define your website’s traffic sources–this channel is like a free spirit that refuses to fit into Google’s predefined categories such as organic search, paid search, social, email, direct, referral, and the like.
This is Google's attempt at playing matchmaker and grouping similar traffic sources together in a harmonious union. They group together traffic sources with the same medium–the type of traffic from the different sources–like organic, paid, etc., so that they’re all neatly categorized.
So, if the traffic source has the “organic” medium, Google will happily hook it up with “organic search,” and if it's labeled as ‘cpc,' they'll lovingly match it with ‘paid search.' Love is in the digital air!
Fixing unassigned traffic could truly be an entire blog post in itself, but I don’t want to stray too far away from the purpose of this blog!
Building a Report to Identify Unassigned Traffic
The best way to understand where that unassigned traffic is coming from is to go to your Traffic Acquisition Report. Add a secondary dimension of session source/medium,” then use your search bar to search for “unassigned traffic.” You will then be left with a list of all your unassigned traffic sources.
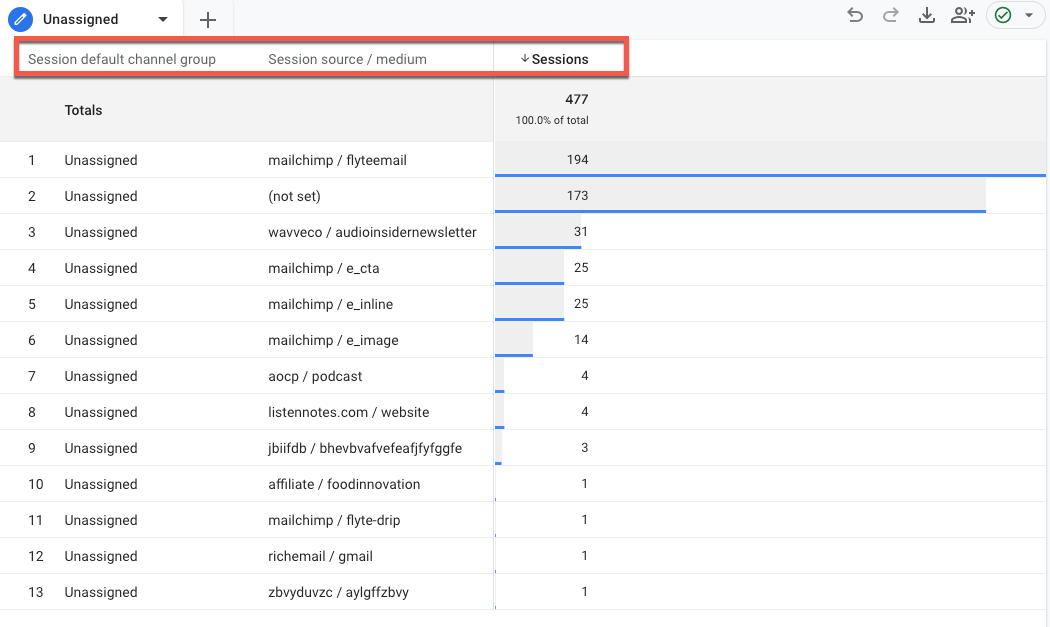
Here we’ve created a GA4 Exploration to simply identify for where our assigned data is coming from. I’ve added two dimensions, Session Default Channel Grouping & Session Source Medium, and one metric, Sessions.
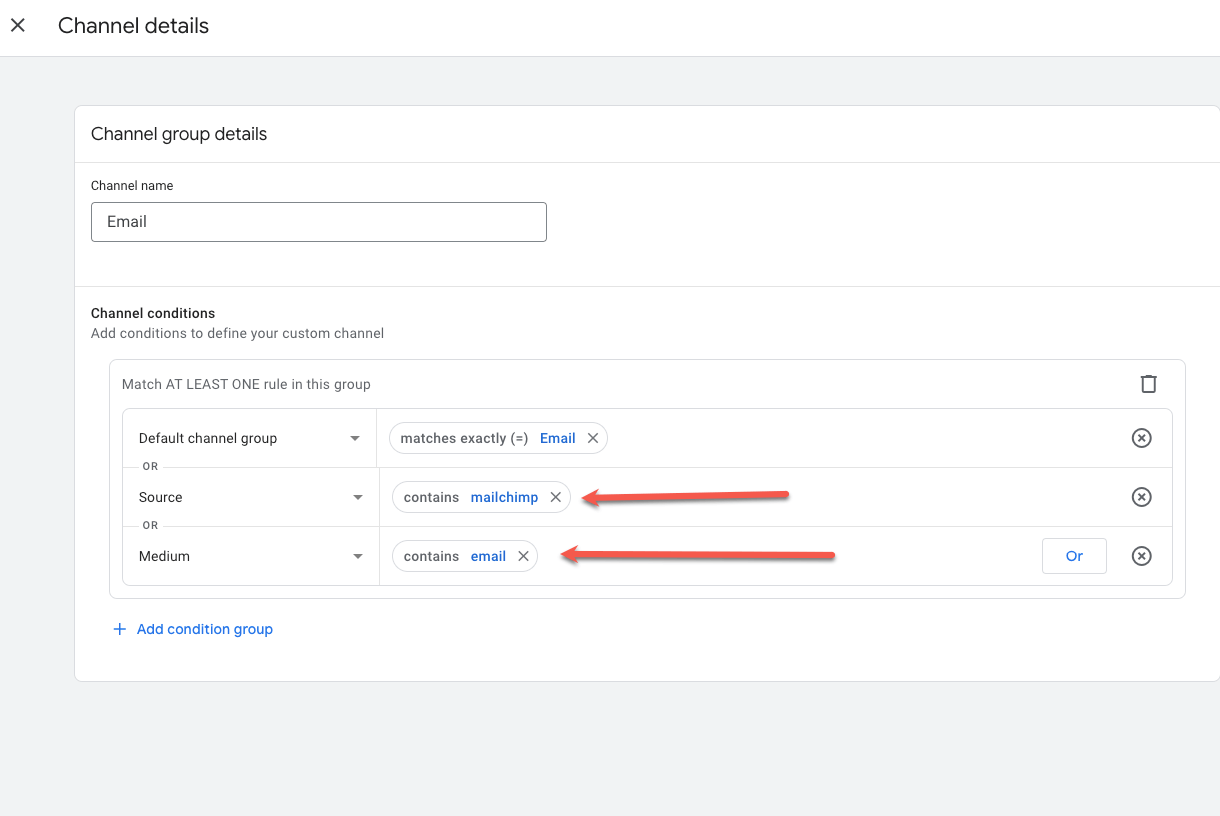
After I’ve identified some of the traffic that is coming from our MailChimp account, I’ve gone into our Channel Groupings and have updated the Email Grouping to ensure we capture all the MailChimp traffic as Email.
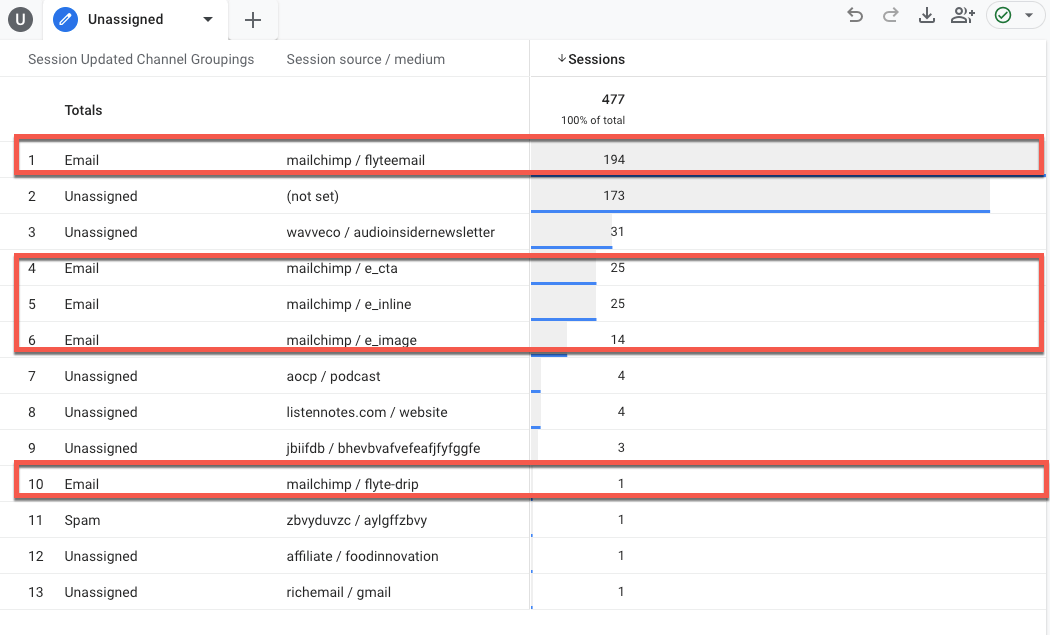
Voila! Notice the difference in how Google Analytics 4 makes those changes in real time! ???
Most of your traffic will probably be listed as “(not set) traffic. There will also be UTM codes that you (or an affiliate, partner, other website) have created, which lead users to your website. Depending on the volume of unassigned traffic you may not need to adjust your small sample size of users. However, if you do need to update your channel groupings, it’s because there are 100+ new users every week entering your website as unassigned.
If there is a good amount of traffic that still shows up as “(not set),” you might be experiencing one of these issues:
- Tracking implementation: If your tracking isn’t set up correctly, then GA4 will have certain parameters or data missing that make it difficult to attribute traffic to the correct source.
- UTM parameters: Not tagging your UTM parameters leads to messy data in GA4, and it is one of the major causes of unassigned traffic (this is the most common issue).
- Ad blockers: Many users use ad-blockers and other privacy tools. Damn cookie blocking software!
- Cross-domain tracking: If your cross-domain tracking isn’t configured correctly, then certain redirects can result in URLs losing their UTM parameters. This means that GA4 won’t be able to attribute that traffic to the source/medium.
- Session_start event: If this event is missing, then GA4 does not attribute the traffic correctly, as it doesn’t know if this is a new session or not.
- Measurement protocol: Missing the “ga_session_id” when sending traffic to GA4? The measurement protocol won’t be able to attribute the data to a unique user session, which can cause issues.
- Bugs: GA4 is still in its infancy stage, so you may just want to chalk this up to Google being buggy!
There’s a sweet spot when it comes to “(not set)” traffic in Google Analytics 4. GA4 set up correctly, plus low average monthly “(not set)” users is not a cause for concern and can be ignored. Building out that report and saving it will help mitigate the poor UTM structures!
2. UTM Reporting
Speaking of UTM codes, there is no quick and easy way for us to find all the UTM structures in one report. This is where I turn to an “Exploration.” While these reports don’t live directly in the “Reports” section, it’s still a very valuable resource inside the GA4 Platform.
While I expect most are using Source/Medium/Campaign in their UTMs, this demonstration will also show you how to bring in “Content” and “Term.” I cannot stress how important UTM parameters are to your marketing. If you cannot identify what source is/isn’t converting, how can you make the best marketing decisions? Having concrete data is crucial in determining your advertising budget or the tools you need to get certain jobs done, and UTMs take your marketing data to the next level.
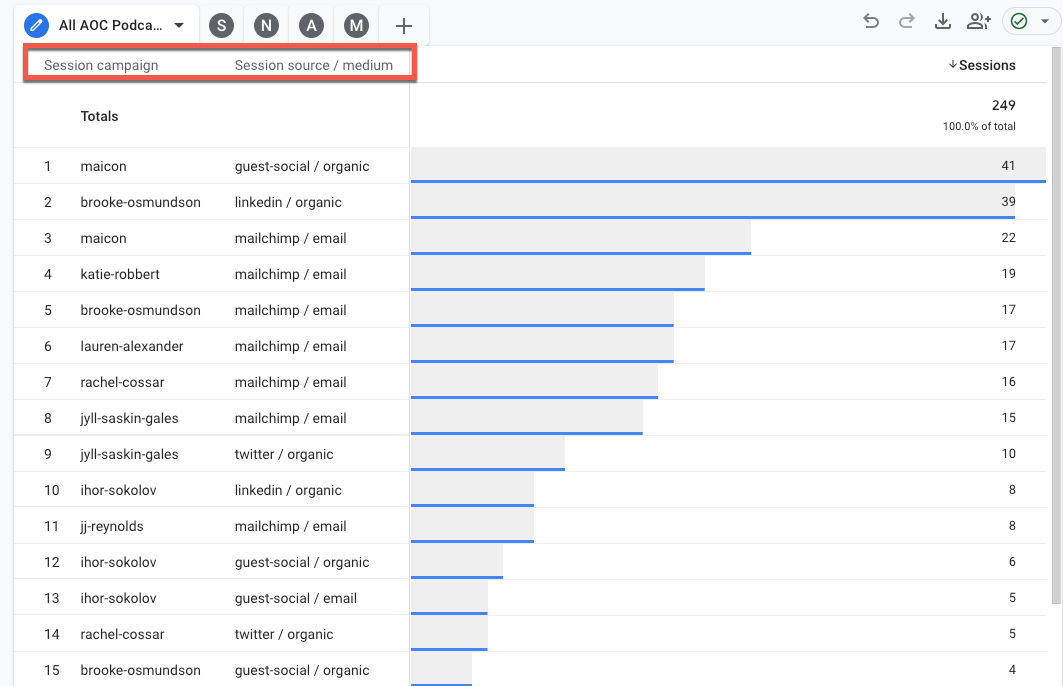
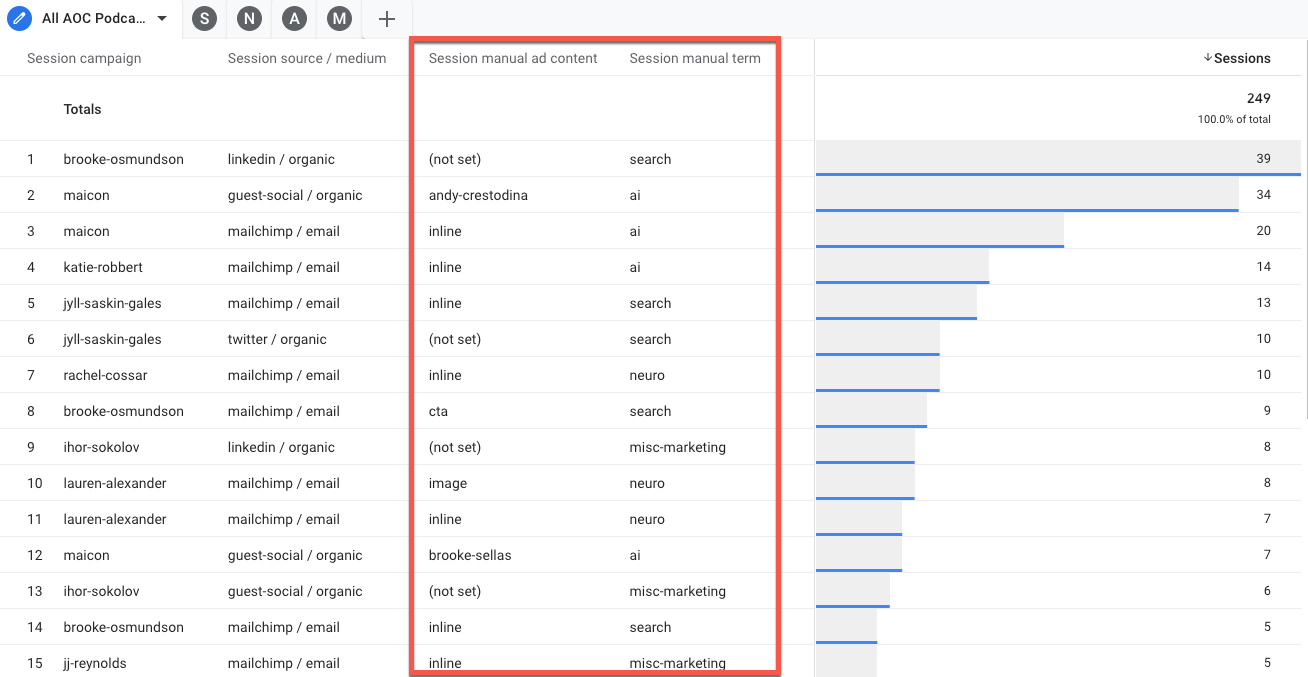
For The Agents of Change podcast, we want to break every episode down by guest, agent, and platform. Our Campaign Name is always the guest’s name, we have built ourselves a custom UTM worksheet so we are accurate with our Source/Medium. With the GA4 exploration that we’ve built here, you’ll notice it’s how we’ve broken this report down.
Sometimes I wonder if I am giving our team too much data.I can’t help but think of Steve Carrel’s famous line in The Office when he berates Toby.

I do this out of love, I hope the team knows that! By adding in UTM Ad Content and UTM Term, it gives us the greater ability to see where these links are successful. It also helps group episodes together since we don’t use the URL string for that! You will also notice that we’ve gone a little unconventional on how we use these two. That’s the beauty about these parameters. We don’t have to play by Google’s rules. As long as there is an internal understanding of what each parameter means, we’re able to group and analyze data in a unique way. Here’s how we use those two parameters,
- UTM Ad Content is our way of denoting what link users are clicking on in our weekly email or if a guest is using the link to share on their social platforms.
- UTM Term is our way of denoting which agent of change the podcast is dedicated towards.
Admittingly, our URL structure has forced us to become very creative with AOC’s podcast episodes! It’s not perfect because there’s direct traffic and organic search traffic still bringing users to those episodes, but from a promotion standpoint, it helps us understand what’s most effective!
Note that Source/Medium/Campaign are the required fields for any UTM that gets built.
3. Social Media Platform Report
We all know how aggravating it is for Google to separate out all the Facebook traffic by what device a user is on, or if they’re using the Facebook App or on the internet browser on their phone. This happens to all of us, and if we’re not using our UTM tracking codes then it can be hard to track all of it down. We’ve created a few short cuts so you can navigate directly to the social platform you’re looking for.
Below, you’ll find an Exploration with a tabbed approach to all pertinent social media channels. This may be the first time you’re hearing about an Exploration, so let me explain. These reports will allow you to analyze and visualize your data in a flexible and interactive way. It's like having a magnifying glass to zoom in on specific aspects of your website's performance, and uncover insights.
Think of it as a virtual playground where you get to ask questions about your data and get real-time answers. Explorations let you customize how you view your data by choosing different dimensions (categories or attributes) and metrics (quantitative data) to create visualizations that make sense to you.
Whether you’re looking for all of your Pinterest, LinkedIn, or Facebook traffic, these Explorations will get all that data into one place, so you aren’t missing any loose ends.
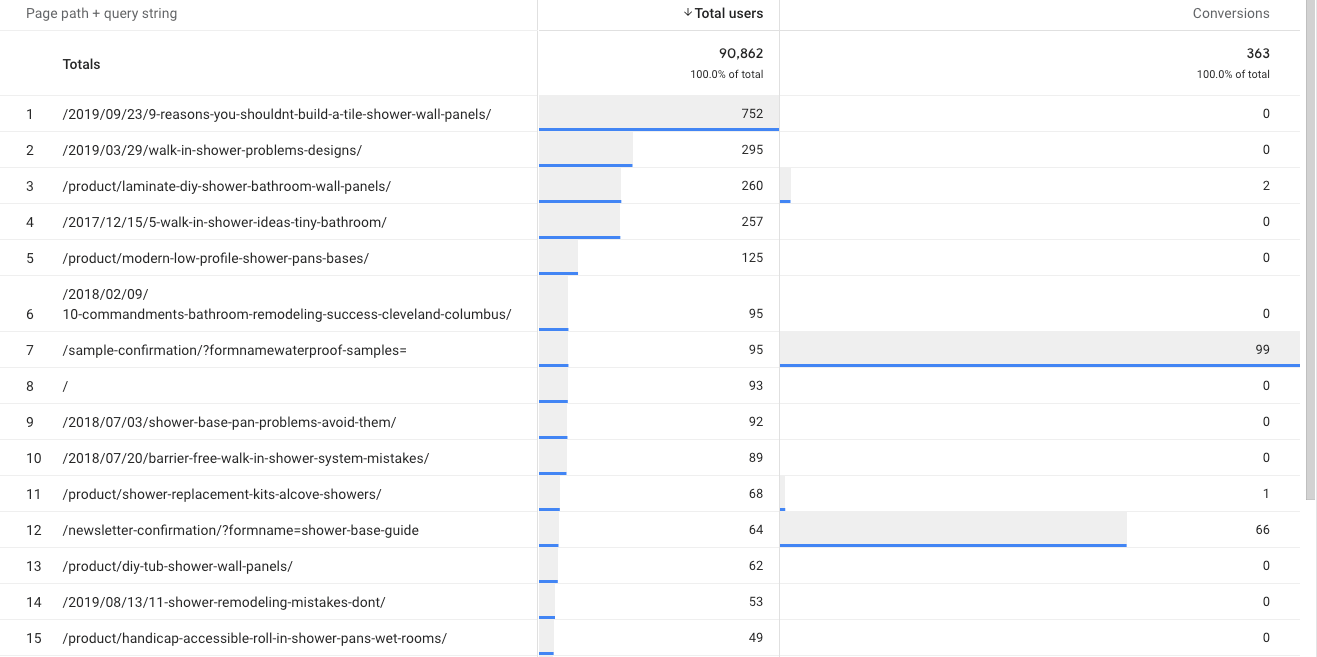
I’ve built out an exploration for Pinterest because this website gets a lot of Pinterest engagement. I’ve added one dimension, Page Path + query string and two metrics, Users and Conversions. I’ve also added a filter for Source/Medium to contain pinterest.
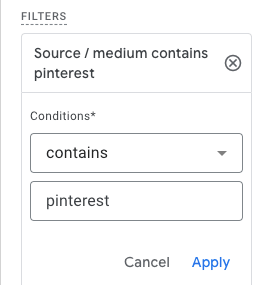
One of the great things about GA4 explorations is that you can create multiple tabs within one report. Since we’ve built out the Pinterest report, you’ll want to click the down arrow next to where it says Pinterst and click “duplicate.”
From there the only thing that needs to be changed is the filter. Change that to contains “facebook.” Continue to duplicate those tabs until all of your social channels have been built out.
4. Exit Pages
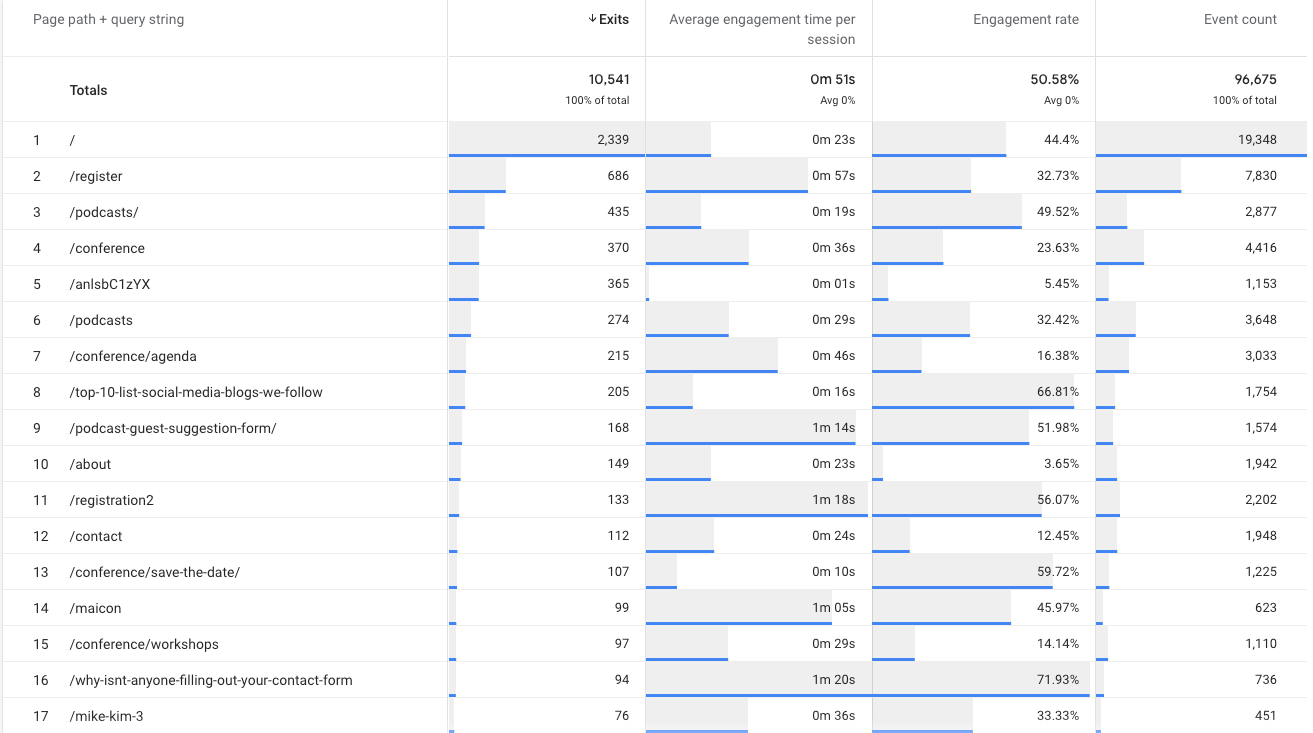
Understanding user behavior and optimizing your website for better engagement and conversions are crucial aspects of digital marketing. Google Analytics 4 offers powerful tools to track and analyze various metrics, including exit pages, the last page of a visitor’s session. Figuring out how users are leaving your website could be the difference between a 15% conversion rate and a 50% conversion rate.
For example, if your service page has a 75% exit rate, what’s causing users to leave? Are they not getting the answers they’re looking for? Is the content too thin? Are there not enough visual aids? You can gather these insights by looking at a few different metrics alongside exit rate;
- Avg. engagement time,
- Engagement rate
- Total events.
You will see that in the report below.
Creating an exit page report in Google Analytics 4 is a valuable step toward understanding how users interact with your website and identifying opportunities for improvement. By following these steps, you can gain insights into user behavior, optimize your website's content and design, and ultimately enhance the overall user experience.
Creating These Custom GA4 Reports
So, I’ve shown you four reports that you build inside your GA4 account. Let’s face it, without major optimizations and building custom reports, are you sure you’re getting accurate data that tells a clearstory of each user’s journey? Do the “out of the box” Google Analytics 4 reports help make marketing (and business) decisions?
Google has provided this customizable resource for us to manipulate the data in a way that we need it! Sure, there are other ways to do this––and that’s what Google Looker Studio is for! However, that’s an entirely separate tool you need to learn to use.
Creating these reports will help you in the long run, no more clicking multiple times and getting frustrated. Once they’re built, you can access them with one click of the mouse!
If you’re looking for help with building these reports or want to strategize about other reports that you may need for your business, don’t hesitate to reach out to me on LinkedIn! I’ll never turn down a dashboard conversation!

John comes to the flyte new media team with a motivation to help clients grow their business and online presence. He brings a lot of enthusiasm and a positive attitude to flyte’s marketing department. He is Google Analytics and Google Ads certified which is where his true work passion lies, SEO, Local SEO, and paid search. He can be kind of a data nerd but that’s never a bad thing.
An avid sports fan, a day doesn’t go by where John doesn’t catch that game, that score, or that highlight play. He continuously joins way too many fantasy sports leagues but don’t worry, his win percentage is still very high. John can also be found adventuring with his wife, their daughter, and Goldendoodle, Harper Lee.