
We’ve said it enough times, but it bears repeating: measuring the performance of your marketing efforts is just as important as the marketing itself. But before you build a reporting dashboard, you need to choose the metrics that actually move the business forward. You know, the Key Performance Indicators.
Not every metric deserves a spot on your dashboard. In fact, the more data you add, the harder it becomes to see what is really driving performance. When data overload happens, you and your team waste time reporting on activity instead of improving results.
That is why every campaign needs a simple KPI scorecard.
What is a KPI scorecard?
A KPI scorecard is a simple framework that helps your team identify the metrics that matter most. It uses your campaign or business’s primary goal to set targets and track supporting KPIs, leading indicators, and guardrails so you can measure performance clearly and make better decisions faster.
To keep performance simple and decision-driven, your KPI scorecard should be the center for your reporting dashboard–aka where you go to look at the most important data.
Think of the scorecard as the quick, high-level summary of your marketing story. While the full dashboard provides detailed data and visualizations, the scorecard gives your team and leadership a fast snapshot of whether things are working and where attention is needed.
How do you choose the right digital marketing KPIs?
How do you create your own KPI scorecard? For every marketing KPI you want to add, start by asking these 3 questions:
- Is it actionable? You should be able to do something with the metric. If a number goes up or down and your team cannot identify a clear next step, it is probably a vanity metric instead of a meaningful KPI.
- Is it tied to a business goal? A useful KPI should connect directly to business growth. That could mean sales, qualified leads, booked appointments, subscriptions, or customer acquisition. If the metric does not support a real business outcome, it does not belong on your KPI scorecard.
- Does it help you improve something? The best marketing performance metrics show you what is working and where to optimize. A strong KPI helps you improve campaigns, messaging, conversion paths, or the customer journey as a whole.
If a metric cannot pass this three-part filter, it doesn’t earn a place on your KPI scorecard.
Keeping your KPI list focused helps your team spend less time drowning in dashboard metrics and more time making smarter marketing decisions.
What should a KPI scorecard include?
 While your scorecard will be unique to your business and objectives, we’ve made a recipe that is repeatable for any industry or campaign. A strong marketing KPI scorecard should include these ingredients:
- A primary KPI
- A target
- Supporting KPIs
- A leading indicator
- A guardrail metric
- Clear data sources
Let’s break down each one.
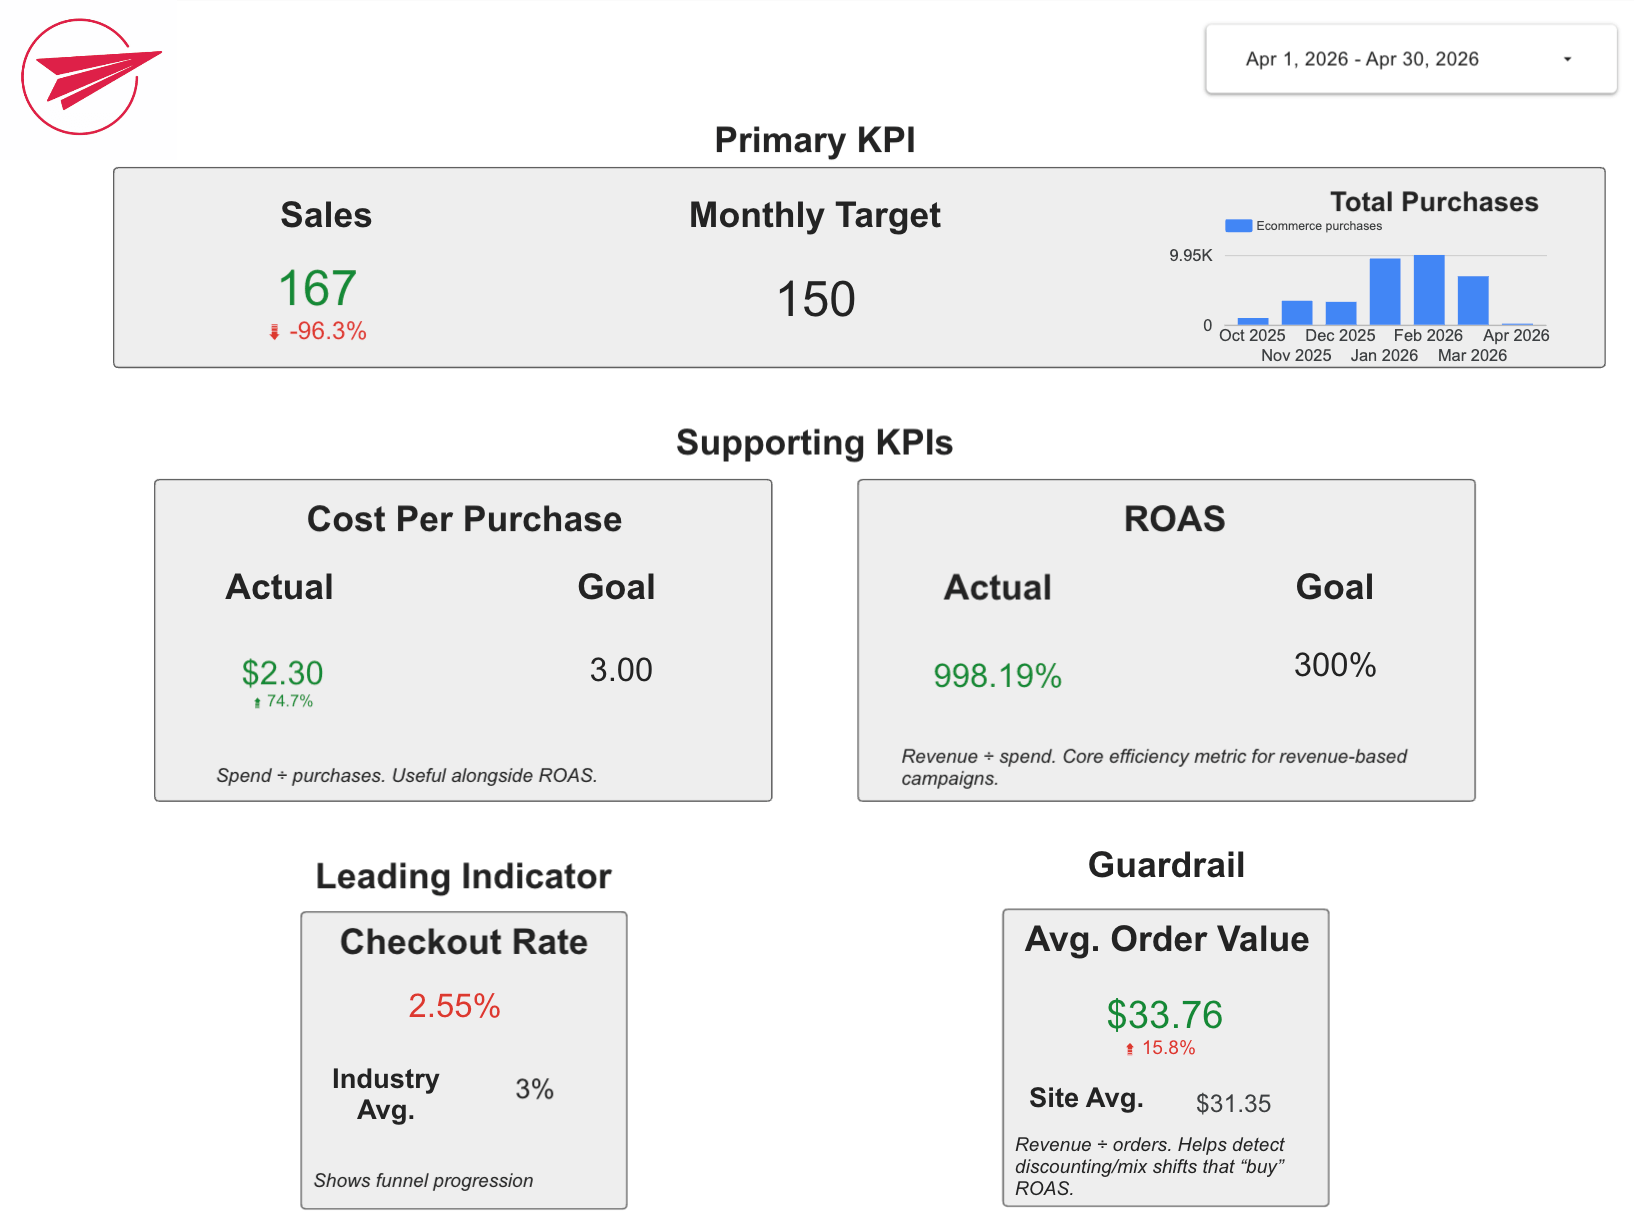
Primary KPI: The Main Metric That Drives Results
Your primary KPI is the single marketing outcome you are paying to create. It represents the ultimate result of your marketing efforts.
Example: Sales
The primary KPI should always align with the organization or campaign’s main objective. For many businesses, that is revenue or new customers. In other cases, it may be qualified leads, booked consultations, or subscriptions.
Keep it simple: your team should always know the one number that matters most.
Target: The Number That Defines Success
A KPI without a target is just a number.
You need a clear target to define success and diagnose problems when performance falls short.
Example: $100,000 in monthly sales
Targets give your marketing performance metrics context. A campaign generating 500 sales might sound great until you realize the goal was 1,500. On the other hand, 200 sales may be a huge win if the target was 150.
Targets turn raw data into meaningful KPIs your team can actually use. They answer a simple question: are we on track or not?

Supporting KPIs: The Metrics Behind the Outcome
Supporting KPIs give you the context you need to understand why your primary KPI is moving–or isn’t.
Example:
- Conversion rate
- Traffic volume
- Cost per acquisition (CPA)
These metrics act like diagnostic tools. If sales drop, supporting KPIs can help you quickly figure out whether the issue is low traffic, weak conversion rates, rising ad costs, or something else in the funnel.
Supporting KPIs are what make a marketing dashboard useful. They help your team move from reacting to results to understanding what needs attention.
Leading Indicators: Early Signals in Your Performance
A leading indicator helps you spot momentum before the final result shows up.
Example: Checkout rate
If checkout rates are improving, that often signals sales may improve soon, even if revenue has not changed yet.
Leading indicators are valuable because they help marketers catch trends early and understand if they’re on the right track. Instead of waiting weeks for final results, you can see movement happening in the customer journey and make adjustments sooner.
Guardrail Metrics: Protection Against Bad Optimization
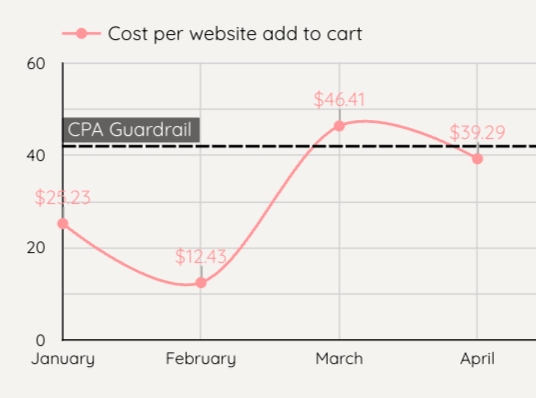 A guardrail metric helps you avoid improving one result at the expense of another.
For example, if your goal is to increase sales volume, you do not want to do that by driving down profitability. A guardrail helps make sure your optimization efforts support sustainable growth.
Example: Average Order Value (AOV)
If you focus too heavily on increasing total sales, AOV can help you catch potential sacrifices to your revenue just to increase transaction count.
Other common guardrail metrics include:
- Customer lifetime value
- Profit margins
- Cost per acquisition
Guardrails keep teams from chasing short-term wins that create long-term problems.
Data Sources: Where the Numbers Come From
Data sources are a simple but critical part of any KPI scorecard.
They make it clear where your numbers originate, which helps reduce confusion and build trust in the reporting.
Example:
- Meta Ads
- Google Analytics 4
- CRM systems
When teams pull numbers from different platforms without documenting the source, reporting gets messy fast. People start debating which number is right instead of focusing on what to do next.
Clear data sources create transparency. They also make it much easier to answer questions from leadership or stakeholders when they want to know where the data came from and how it should be interpreted.
Why KPI Alignment Matters
At a high level, most measurement problems are really alignment problems.
Without a shared plan, departments end up operating in separate bubbles, each focused on different metrics and priorities. Marketing may care about traffic, sales may care about lead quality, and leadership may care about revenue. When those numbers are not connected through a shared framework, reporting becomes confusing and decision-making slows down.
A KPI scorecard gets everyone moving in the same direction, with one shared view of what success looks like.
When alignment happens, conversations shift from debating numbers to improving performance.
If your reporting feels scattered or your dashboard is packed with metrics no one actually uses, that is usually a sign the team needs clearer alignment, not more data overload.
Start Small and Build Momentum
Let’s keep this simple: data should start a conversation, not create panic.
A lot of teams (and plenty of busy business owners) make the mistake of trying to measure everything at once. The result is usually a bloated dashboard that looks impressive but rarely helps anyone make better decisions.
A better approach is to start small.
- Identify your primary KPI.
- Define your target.
- Add a few supporting metrics that help explain performance.
Then build from there as your team gets more comfortable using the data and acting on what it shows.
You do not need perfect measurement or fancy-looking charts on day one. You need a KPI scorecard that gives your team clarity, alignment, and the confidence to make smarter marketing decisions.
If your dashboard feels cluttered or your reporting isn’t tied to real business results, now is a good time to simplify your measurement strategy.
Need help building a KPI dashboard your team will actually use? Let’s chat about creating a reporting system that ties your marketing to real business results.

Izzy joins flyte after moving to Portland in 2020, a city that is affably similar to her beloved Burlington, Vermont, with the added benefit of ocean air and fresh seafood. With a degree in English and a background in the nonprofit sector, she carries a curiosity for all things communications. From social media and email newsletters to website management and SEO, Izzy is involved. Reach out to Izzy today!