
Getting Started with Google Analytics [30 Minute Webinars]
Download Audio (mp3) | Download Slides (pdf)
Welcome everybody this is Rich Brooks and this is another 30-minute webinar by flyte new media. Today’s topic, as you can see on your screen, is getting started with google analytics. Google Analytics is the proverbial iceberg, actually before I start I just want to say in these 30-minute webinars you may have questions. I want you to pose those questions in the questions box but I will probably not get around to them until the end. I’m focused in getting all this content in an efficient manner within 30 minutes and then I’ll open it up for Q and A. So as we go through if you have questions about anything I’m saying just go ahead leave a question and I’ll tackle it as we get to the half-hour.
As I was saying about Google Analytics, it is the proverbial iceberg, but as big as it seems there is always more to discover. We could probably do a hundred 30 minute webinars in google analytics and still not hit in all the ways it can help you make more sense of your traffic. My goal then is to focus on how you as a marketer, a consultant, as a small business owner can better read the tea leaves and start making better business decisions. To that end, I’ve created back to back Google Analytics webinars. You’re seeing part one today. Part 2 is here.
Today focuses on how to optimize Google Analytics to get the best data possible and then in about 2 weeks we’ll do another google analytics webinar where we’re going to dig into the most important reports you can get out of google analytics and when I wrap up today I’ll send you an email so you can watch the on-demand content and I’ll also have a signup registration where you can sign up for that next class as well so you won’t miss anything. It’s important to understand that google analytics will never give you an exact picture of what’s going on with your website, but the more we optimize the setup, the more accurate and the more telling the data will be.
So don’t think of this session as some sort of beginner session, this is more like the fundamentals. The difference is most people skip the fundamentals and so they never get the best data possible. I work with hundreds of small, medium-sized businesses and almost none of them set up Google Analytics the right way, we always have to go in and fix things or them. Now the nice thing is even though I’m calling this getting started with Google Analytics, you might have a year or two or three years worth of data, that’s great but what I’m going to show you how to really make the most of it.
The BARE Essentials of Digital Marketing
Before we get started, I’m just want to share with you a framework we use here at flyte new media to help all of our clients make sense of their digital marketing and it’s called the BARE essentials of digital marketing and BARE is an acronym.
- The B stands for build or how to you build platforms or websites that turn visitors into customers.
- The A is for attract or how do we drive qualified traffic to our websites, primarily it’s about search engine optimization, social media, and digital ads.
- The R is for retain and retain is all about how do we stay in touch with people after they’ve left our website and the big focus there is email marketing and retargeting.
- The E is for evaluate, how do we measure and analyze our results, obviously google analytics plays a huge part in that, it’s not the only part of evaluating because we can get great data also from tools like Crazy Egg that we don’t get in google analytics and of course our email service providers like Mailchimp or constant contact, give us report and Facebook, Twitter and Pinterest, and YouTube all have their own different types of metrics as well.
All of those are helpful in painting a picture that gives us a better understanding of how we should be marketing our business. But the biggest most important piece of that puzzle is definitely google analytics and we’re going to start there today.
Who is this guy, anyway?
Now you may be wondering who I am, I know some of you know who I am but not everybody does, my name is Rich Brooks and I’m the president of flyte new media, we’re a web design and internet marketing company located in beautiful Portland, Maine. I’m also the founder of the Agents of Change, it’s a weekly podcast and an annual conference that brings in speakers from around the world to talk about how to reach more of your ideal customers through search, social, and mobile marketing. I’m also the tech guru on 207 which is the evening news program on the NBC affiliates here in Maine where I do hard-hitting news stories on things like how to find the best recipe websites online and how to take better pictures with your smartphone. And last year I wrote a book called the Lead Machine: The Small Business Guide to Digital Marketing.
Logging Into Google Analytics
So with all that being said, let’s dive into Google Analytics. Now I originally consider doing this as a live recording, but figured it might be easier if I just took some still images instead. The first thing you’re going to do is you’re going to log into Google Analytics and you can do that on google.com/analytics or analytics.google.com. You’re going to log in with your Google username and password, so that’s probably going to be your Gmail address and the password you created for it or at least the one that’s associated with your business.
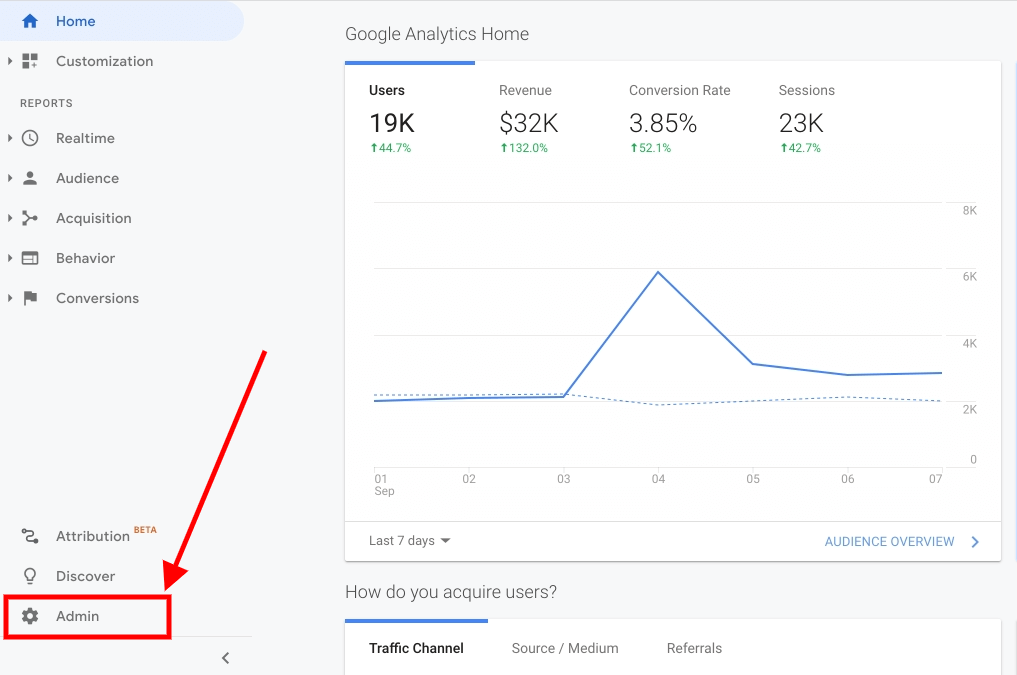
Once you do that you’re going to see a screen that looks something like this which is basically a dashboard of some of your traffic over the last seven days. Some nice visuals, sure, but I don’t find this especially useful. Instead our journey is going to begin in the admin section down in the left hand corner.
Google Analytics Admin Panel
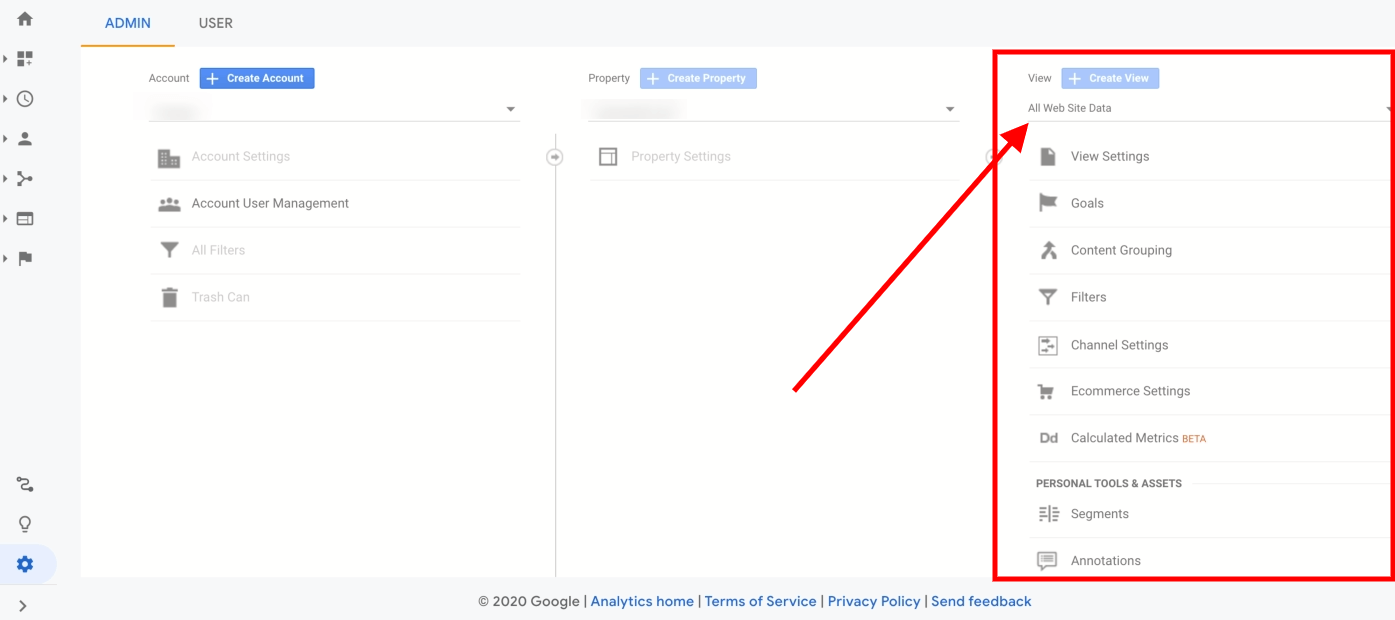
Now once you click on that link, you’re going to see this screen and this is your admin screen, and there’s three columns, account, property, and view and as you can see there’s a lot of options in each one and some of them may be grayed out meaning you don’t have access to them. In these screen captures since I’ve logged in as myself and not flyte new media there are a couple things that are grayed out for me, so don’t worry about them.
Now the account column is basically about the organization that owns this account, it’s called takeflyte.com as you can see but easily it could’ve been called flyte new media or anything else I wanted to name it. After account comes properties, so flyte new media could own multiple properties and you can see the property here id the domain or the website for takeflyte.com . if this was a live performance I could click on that little down arrow and you’d also be able to see the agents of change, themarketingagents.com, theleadmachinebook.com, and a few other properties that are all under that account. Then in the third column you’re going to see view and view are just different ways of looking at the property to the left and we’re going to spend a little bit of time in view in just a few minutes.
Now if you haven’t yet installed google analytics, you want to get started with that right away because as powerful as google analytics is, it can’t travel backwards through time, in other words it only starts collecting data from the moment you have it installed. What you want to do is click on the tracking info link right there and that’s going to open up a screen that looks like this. And you see that code that’s all in blue, it’s usually going to have a unique ID number after the UA that’s going to be specific for you, so you’re going to want to copy and paste that into your website. You’re going to want it to be put on every single page and very single post, now obviously that would be very time consuming, but thankfully most of us are on content management systems like WordPress these days or maybe you’re on Squarespace or Wix.
If so there’s usually one place you can put this code and then it’s going to automatically appear on all of your pages and all of your posts. You can also use something called Google Tag Manager, which we’re not going to get into today, as another way of getting this information in there. Now if you’re not sure what you’re doing hand it off to your web developer and if you don’t have a web developer, send me a message after this webinar and I’ll hook you up. So once that’s installed on our website’s Google Analytics can start tracking information and visitors at our site.
Creating a New View within Google Analytics
Now let’s take a look at that view column on the right-hand side. Chances are you have a view called “all website data,” that’s the default setting for any new account on google analytics.
Now the very first thing you’re going to want to do with this view is to create a duplicate of this view and never touch it again. Here’s why, you want to protect your data at all costs and as you get more sophisticated with google analytics you may add filters and other cool options that are going to provide you with better detail and better data. Unfortunately, it’s not hard to accidentally filter out critical data. If you don’t have that original all website data you may lose that data forever. I know, I’ve done it, we’ve done it, clients do it, one time somebody was trying to focus a view just looking at their blog traffic and unfortunately filtered out all of their website traffic except their blog traffic for an entire month before they realized it.
These are important things you want to make sure you don’t make the mistake of but if you do you at least have that original all website data. As google states, because some analytics features fundamentally alter how data is collected or processed in your account in ways that cannot be reversed, you should duplicate the original view before making changes, you heard it here first. First, we’re going to click on “all website data,” that’s going to open up this little window right here where we’re going to click on create a new view. You can see all the views that you have here, in this case, there’s only one, all website data. I click on create a new view and now I’ve got this screen right here and by the way, if you feel like I’m going so fast and you’re maybe trying to keep up with me or do this on your own, don’t worry not only are we recording this live, we’re also going to separately send you all the slides for this.
Now you’re in new reporting view and chances are this is going to be for a website although it could be for a mobile app, give your reporting view a new name and separate it from the original one and for reasons that will become evident shortly, we’ll call this one all website data with IP exclusions, you could call it Fred for all I care. Make sure your reporting time zone is appropriate, I have the US Eastern Time and go ahead and create that view.
View Settings in Google Analytics
Once that’s done we want to check it and improve it. I’m then going to click on view settings in the left-hand column. Now this is for a view we’ve already created at flyte, let’s kind of walk you through what’s going on here. The first thing is I can alter the view name if I want to, the next thing is I’m going to put in the URL that I’m actually tracking now this seems kind of obvious but this could also be something like blog.takeflyte.com or store.takeflyte.com the HTTP could be HTTPS in the little pull-down, so there are some options here.
Again we could tweak the time zone country or territory, default page I just leave alone, exclude URL query parameters I just leave alone, and if the currency is displayed as US dollars I leave that too. The next important thing I want to draw your eye to is the bot filtering. This is not checked off by default and you absolutely want to check this off. What this does is again we want to collect only the important data and so what we’re going to want to do is we only want to get rid of any data that isn’t relevant to us so search engines send bots our way to kind of check out our site, other services do as well, and there’s also scammers and spammers out there who are sending us traffic that really is not relevant for us, it’s basically just to ping our site and bounce it off to somebody else so they can say they’re doing work that they’re actually not doing, I won’t get into the details. It doesn’t hurt your website, but again it muddies the water so what we want to do is exclude all hits from known bots and spiders and all you need to do is just check that box.
As we scroll further down the page we’re going to see some more things, we can connect our Google Ads Account, also if you’ve got a search bar on your website you want to turn on search tracking so click that on and then you’re going to want to put in your query parameter, which in this case is “s”. Now you may be thinking what is a query parameter and how do we know it’s actually “s”? So it often is s but not necessarily so what you want to do is you go to your website like I have here, and you do a search so I’m searching for bacon on the takeflyte website and then you look at the URL on the resulting page. You can see it’s takeflyte.com/?s=bacon&submit=search. It’s the s or whatever letter or whatever word comes right after the question mark is going to be our query parameter so I take that s and put it in here. For WordPress, I find that it’s almost always “s”, for some other ones I see “q,” but again just do that quick test and you’ll know what to put in there.
I usually leave the next two boxes; strip query, parameters out of URL, and site, search, categories as they are and these are really only important, my understanding is, eCommerce. I should say that there are a million ways to look at Google Analytics, to read analytics, to teach analytics, and I’m trying to provide you with a way that makes the most sense for most small businesses.
The next thing we want to do is control our user management and you can see right there where I can control it in each view, but you might also notice that there is user management both at the property and account level, you can control it at this level but we’re just going to focus on the view for right now.
Google Analytics User Management
Click on user management and you’ll see a screen like this and you can see we’ve already given some people access to this particular account. Up here in the top right corner, you can choose to add more and when I click on that I can either add new users or add new groups, and almost invariably I’m going to add a new user, not a new group. So I click on add new user, I type in an email address, it has to be an email address that’s connected to another google account, in this case, I put in contact.flyte@gmail.com, you probably want to notify new users by email. Then down below you’ll see three levels of permissions and from the bottom up it’s Read & Analyze, Collaborate, and Edit.
- Read and Analyze is basically view only, you can do a few things more than look at reports but not much more.
- Collaborate allows them to do a little bit more, especially on shared assets.
- Edit gives them virtually full control of your analytics. This is important if you have a webmaster or if you have an agency like an SEO agency or marketing agency working with you, you want to give them different access to your analytics.
Down at the bottom, you can see you can also allow somebody to manage users. This is very dangerous, very powerful, so I would never give that kind of level of access to your developer or your agency unless there’s a very good reason to do so because of course they could actually delete you off the account and we certainly don’t want that to happen.
How to Setup Goals in Google Analytics
The next big thing up is setting goals. The purpose of having a website, in my opinion, is to convert visitors into customers or leads. We want people to take the desired action on our website. Maybe it’s to fill out our contact form, pick up the phone, to sign up for our email newsletter, or to make a purchase. Goals in Google Analytics is how we measure our success and get better information about where our best traffic is coming from and maybe where it’s falling off. So let’s take a look at how we can set up a goal in Google Analytics.
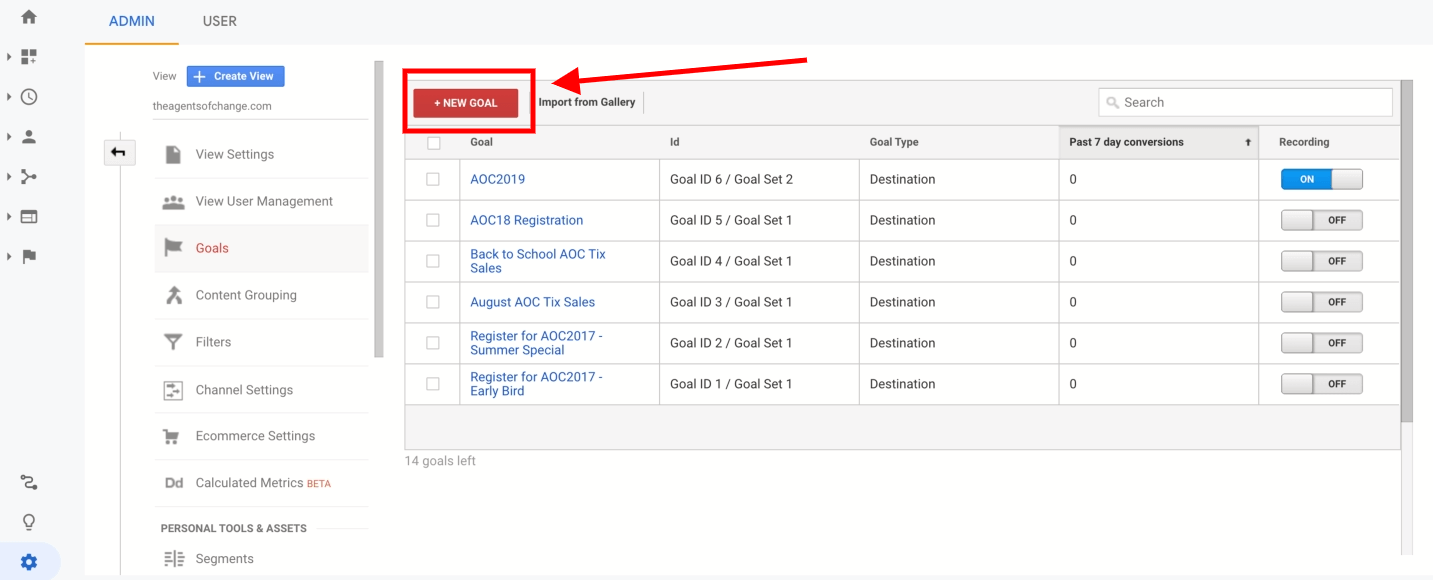
Basically, once we click on goal our screen looks like this and we click on a new goal and you can see flyte has a number of different goals that we’ve set up and we’re tracking, some of them are new, some of them probably need to be retired but we click on a new goal and the first thing we’re going to see is we want to set up our new goal. We can either choose a template or create something custom.
Luckily, most of which you’re going to want to track here or set up as goals are in the template so you can usually start from there. I certainly would recommend starting from there if you’re just getting started. One of my favorite goals to set up is just when people fill out your contact form. Luckily there’s a ‘contact us’ goal already set up under inquiry and so we just click on that and then we move down to step two which is the goal description. I’m going to call this one contact us because it seems pretty self-evident and this is a destination goal, what I mean by that is when somebody fills out a contact form on flyte new media or any of our client websites they are taken to another page, a “thank you” page where we can provide more information, downloads, whatever it is we want to do, but most importantly because it makes it very easy to track who has completed our contact form.
This becomes a destination goal meaning we’re tracking when people get to a certain destination, but as you can see there’s also duration goals, how long somebody spent on our website, pages per screen per session, so if you want to say it’s a successful visit if somebody visits 5 or 10 pages you can do that, or an event such as if somebody plays a video or downloads a pdf or uses your online calculator, all of those can be considered goals, but we’re going to stick with destination in this case. And the last thing is we’re going to say where this thank you page is, in this case it’s /contact-thank-you. As you can see I’m not putting in my domain name it’s just the part that comes after my domain name and then I’m going to assign it a value, in this case I assigned it $750. You may say why that, how did you come up with that? It’s a round number the way I came up with it is one year a couple of years back I took our year and profits and I divided it by the number of times our contact form was filled out and it was approximately 750 dollars and that’s basically how I came up with the value.
Yes, sometimes, people reach out to us and they start a project because they’ve seen me speak or they pick up the phone, but on the other hand, a lot of times people fill out our contact forms, and basically it’s people from foreign countries looking for us to outsource our SEO to them, so overall $750 just seemed to be a good round number to say that this is the value of somebody filling out our contact form on average. Obviously some of them are worth zero dollars and others are worth tens of thousands of dollars. I chose not to turn on the funnel but if you have an eCommerce store I recommend you do turn on the funnel and then you can put in every step along the checkout counter or the checkout process so if you find people are leaving during the checkout process you can actually find out which page is causing people to leave and then go in there and fix that page so that you get improved conversion rates and sell more product. Then we’re just going to go ahead and save this goal.
Filtering Out Data in Google Analytics
The next thing I want to talk about is filters and I mentioned a few times that we really want to hone down a lot of our traffic to get better data, we want to get rid of unimportant traffic so we can really see what’s going on. One of the most important things I think is to set up a filter to get rid of our own traffic because we often visit our websites and we don’t behave like our typical client or typical prospect so I’m going to show you how to do that. So I click on filters, I’m going to add a new filter as you can see I’ve already created a number of them here, I’m just going to show you what it would look like to create a new one. Let’s say I wanted to filter out the traffic from flyte new media’s offices, so I give the filter a name ‘flyte’s offices’, the filter type is going to be exactly this, it’s predefined as I’m going to exclude traffic from a specific IP address that are equal to then our IP address. Now you may be thinking, Rich how do I find my IP address, well just ask google. Type in ‘what is my IP address’ to Google and Google will tell you what it is, copy that and paste it into the IP address section right here and you’re off to the races.
This only works if it’s a static IP address, not if it’s a dynamic one, but these days almost all businesses and most homes have a static IP address, so this tactic will work. If you’re not sure try checking your IP address two days in a row, if it’s the same it’s almost certainly going to be a static IP address, put that in there, save it and now google analytics will basically ignore any traffic from your office. You can also do it from your home office if you spend a lot of time there, but I wouldn’t recommend doing it at the local Starbucks, otherwise you’re going to filter out all the traffic from that Starbucks.
Now we’ve kind of done everything we want to do as far as how we want to set up google analytics to get the best data possible but I want to show you some things in the last few minutes on ways to receive and view the data in the best way possible. We’re going to leave the admin area and enter customization, which is this little circled area I’ve put right there.
Creating Dashboards in Google Analytics

So let’s get back to dashboards, I said that it wasn’t important but I meant just their first one, so let’s create a dashboard that maybe would be more of value to us. Dashboards are just snippets of the reports that we’re going to go into more on the second section of this google analytics. So now that I’m out of the admin section we can see more going on here. We have the home where we’ve just arrived, customization where we are now, real-time which is fun but it really doesn’t help us it basically tells us who’s on our website right now but that’s not really valuable unless you have loads of traffic. So the real areas we really focus on as small business owners or marketers is our audience who is coming to our website, acquisitions how did they find their way here, behavior what did they do when they were here, and conversions did they take the desired step, but first let’s focus on creating a new dashboard.
I click on that create button and as you can see here I can choose between black canvas or starter dashboard, I could even import from a gallery, yes thousands of people around the world are creating their own dashboards and then making them publically available, they don’t share their data just the way their dashboard is setup. Let’s keep it simple but feel free to explore further, I’m going to create a new dashboard called starter dashboard. So here’s what it looks like and you can see it’s called starter dashboard and you have all the data in there and you can move these things around. These were just the dashboards that had been automatically created, I can edit them, remove them, I can switch them around. Let’s show you I want to take a look at the new user’s but that information is not exactly the way I want it displayed, there’s something else I want to get out of this so I click on that little icon there and I get this pop up of all the different ways of displaying information there but I also want to change it. I chose a bar chart and then I say I want to see new users grouped by age. Now there are a million ways you can do this but this is just one I chose, I click save and now you can see the data is presented completely differently, showing the breakdown of users by the age. I’m not saying this is the most relevant report ever but it does show you that you can really alter this to make it make sense for you.
A couple of other things I just want to point out on this page; I could add a widget so if there’s a report that didn’t get pulled in to this dashboard I can just click on that and bring it in, I can share this with I mentioned other people can share their dashboards I could share it, I could also just export it and save it to a pdf or excel spreadsheet for a download, but let’s look at this email option.
Let’s click on the email and then we’re going to get something like this. Let’s say you work for the man or the woman as it may be and you want to share some of the data in here and you know they’re not going to check their google analytics so I want to share with my president say, so I type in my president’s email address, president@mycopmany.com, I give it a subject, I make the dashboard a pdf and basically every week that I’ve set it up, every Monday my president is going to get this report, this dashboard, along with a little message from me that says here’s our weekly report on how the marketing team is delivering fresh leads to the sales team, look forward to my review.
Now you don’t need to be as snarky as that but you’re getting the impression that whether you’re working with other people in your company, yourself, or with clients that you can automate a lot of these reports and dashboards that are being sent over to your client, pretty sweet stuff.
Changing Dates in Google Analytics
Click on it and it opens a new window, and then I change it to the last 30 days and apply that and you can see all of the sudden the data is for 30 days and you can see where the weekends and the weekdays are, just because we’re B2B it’s pretty obvious and all my numbers have gone up. I also like to see how I’m doing compared to a previous period. Now the default is the previous month but I’m more curious to see how I did this time last year. So I shift it over to the previous year, again I’m going to click apply, and now you can see side by side how I’m doing compared to last year. Down below it’s going to tell me users is up 12.46%, new users is up, sessions is up, I can see that I’m doing better than last year at this time which is all great information. As we navigate through all the reports there is in google analytics this side by side comparison will continue on, however, I find that a little that confusing for right now so I switch back to the one month at a time sort of view.
Adding & Editing Annotations in Google Analytics
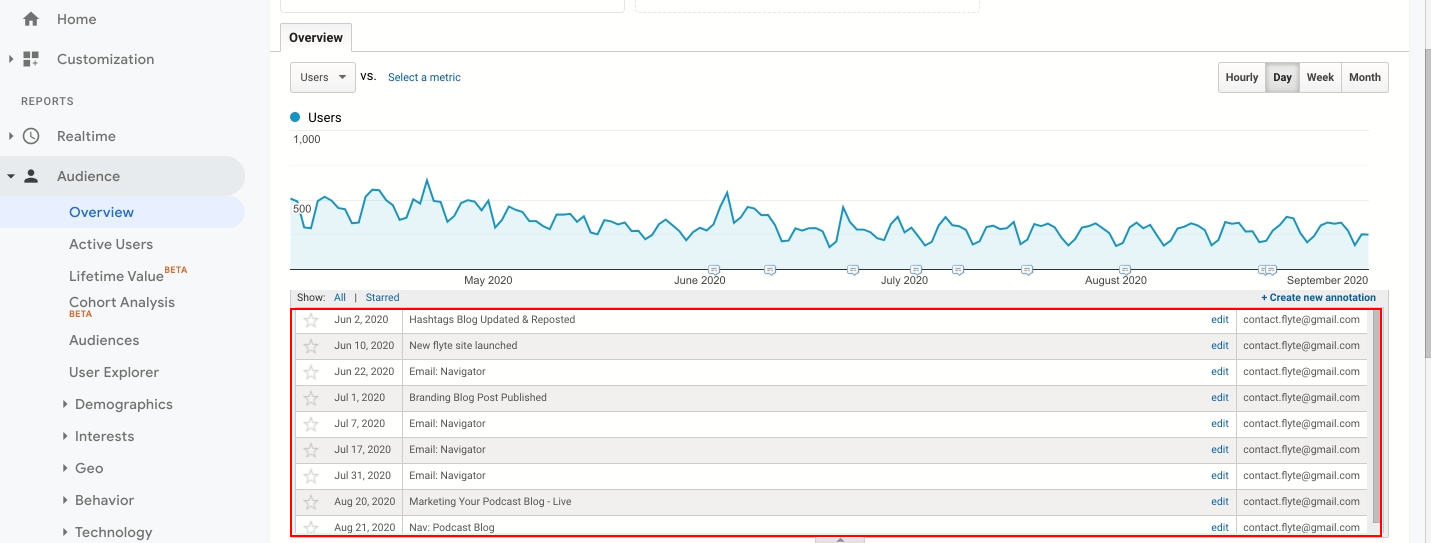
I also want to, let’s pretend for a moment, that on January 29th there was a huge spike in traffic, well maybe I want to remember why that traffic was. So you see this little tab down there that I’m hovering over, that’s the annotations tab. So I can go ahead and click on new annotation and that’s going to open this up and like I said we’re going to pretend that January 29 had a big spike so I’m going to go in and type the date and then I’m going to say what happened that day, I sent an email newsletter, the visibility by default is shared, I could keep it private if I didn’t want to share it with my team members, and click on save and now for anyone who comes to my analytics, who has permission obviously, can see that there’s an annotation on January 29th and if they click on it they’re going to see what it was and who created it and if I want to hide the annotations again I can just click on that bar. That doesn’t change any of your data but it does give you some context around it.
Creating Segments
The last thing I want to show you today is segments. What you couldn’t see because of the size of the screens is flyte has an embarrassingly high Bounce Rate. A Bounce Rate is when somebody visits one page of your website and no others, so to counter that or to get better data one of the things I can do is create a segment. Here I am I click on add segment and I get a pop-up of a bunch of different segments that have been created and google analytics has so many but let’s just say I want to take a look at the traffic that didn’t balance, that visited more than one page of my website and then I apply and now I can compare and contrast and you can see obviously the bulk of our traffic is this bounce traffic, and here you can see 90% of our traffic bounces. That is in big part because we have over 2000 blog posts and a lot of those blog posts answer a question and don’t necessarily pull somebody into our website, which is neither good nor bad, it’s good to get the traffic, it’s bad that they’re not converting, but now I can pay attention to people who spent a little more time on our website and most of our profits are coming from those people, the goal completions are coming from those people so there’s a lot of good stuff going on and then if i pay attention only to the non-bounce sessions and then I can go into different reports and we’ll get more into reports in our next Google Analytics webinar we do, is landing pages and I can start to see what are the most valuable landing pages for the people who are actually good prospects of ours. People who visit one page and leave are not great for us, people who visit multiple pages are likely to end up spending money with us and at the end of the day, that’s what businesses want. So there’s a lot of good stuff and you’re probably chomping at the bit to get into the reports but these are 30-minute webinars and we are officially over by 34 seconds.
So let’s just call this one a cliffhanger. That’s all the content we have for today. I am looking forward to going over all of the reports in google analytics with you or at least all the ones I think are going to be relevant to your business. To get to those basically just tune in like I said, we’re going to be sending out an email with a link where you can register for the next one, be sure to check that out. And now we’ll head over to the questions and see what kind of questions people may have.
Thank You
Questions from Webinar Attendees
Q: We’ve had ours for several years but I don’t see anything in our audience overview, I don’t know why?
A: I’d probably have to look at your analytics myself but very often if you create a new view, that view won’t show any data. In fact when I taught this google analytics as a masterclass here in the offices almost every single time that’s what it is, that you create a new view and suddenly all of your data is missing. It’s not missing it’s just in the original view and not in the one you’ve just created.
Q: So does your normal view become the new view you created?
A: I believe Google Analytics will always remember the last one you looked at so it will just become your default one. If you decide that you do want to create a new view and that’s the one you’re going to use going forward to add all of your filters on, just be aware it won’t have all the historical data that your all website view might have but you can always switch back and forth get that data and take a closer look at it, I hope that helps.
Q: How do subdomains work with goals? Like if you have a subdomain set up in your Google Analytics.
There is something called cross-domain tracking that gets a little technical. I will try to find an article on that and include it in my recap but you can track data when let’s say you had a website like mycompany.com and you had your blog set up at blog.mycompany.com and you wanted to track back and forth you can actually do that using cross-domain analytics, but it shouldn’t make a difference in terms of the goals specifically.
Q: Any plans on doing a Google Adsense webinar or How To Monetize a Blog?
A: Definitely we plan on doing one on Google Adsense but that’s probably going to be a little off in the future. I am planning to do a blog one but it was a little less on the monetizing side of things, but I am always open to new ideas. So send me an email with some specific questions, I’ll see if I can’t help you out.
Q: Do the annotations show on the reports sent to others?
A: I do not believe they do, I believe they’re only right there, but there may be an annotations report. And this is what I mean with Google Analytics, I might say something doesn’t exist and yes it does you just have to change a few filters and set things a certain way, but I don’t necessarily believe it would pick up the annotations in that report that you send.
Q: If I switch to HTTPS is that a problem?
A: That is a loaded question. So there are complexities when switching your website from an HTTP to an HTTPS, I don’t think that’s what you’re asking though. There are benefits to an HTTPS, in fact, for SEO we recommend that everybody switch to an HTTPS, but I don’t believe that just switching from HTTP to HTTPS is going to be a problem within your google analytics if you’re thinking about that pull-down area that I mentioned before.
Q: How do you make a copy of the all website view?
A: There’s two ways to do it. If you can see here on my screen ‘create new view’ you can just click on that and then you’ll get the new view. Also if you’re back here and you click on the new website data when you’re in view settings you can also copy this view, but again you’re not copying any data you’re only copying the way google analytics looks at the view. So you don’t just get to bring all of your data over, unfortunately.
Q: if you add the website tracker code to your pages do you have to manually go in and add it to any new pages?
A: Not if you’re using a content management system like WordPress, then every time you create a new page it’s going to pull in that Google Analytics code for you.
Q: Curious to how the age of viewers is determined, isn’t the IP address the only identifier?
If only it were. Google knows almost as much about us as facebook. So as you have your google account, maybe a gmail address, you go surfing the web and doing searches and doing tracking and entering in information, googles gathering a lot of that information on you. Some of it’s guesswork but most of it’s because you provided that information one way or another. Probably if you go back and look at your terms of service when you signed up for gmail it probably said we’re going to be tracking everything you do and we know how old you are. It’s not perfect and I think if you go in and you look at it it will often tell you what percentage of people they actually know about the age as opposed to everybody but it does give you a pretty good picture in terms of a marketer in terms of the age.
Q: Is there a way to track individual blog post? We just added that code through joomla.
Yes you can absolutely track every single page and every single blog post on your website automatically. If you’re using joomla which is like wordpress, in terms of that it’s an open source content management system, in your editor, in your code you should automatically populate to every page on your site that way you can track how many times people have visited that, how many times people found it through the search and other things that we’ll definitely be tackling in our next session.
Q: So any view you create starts with zero history?
Unfortunately the answer to that is yes. I was very frustrated, spent quite a bit of time in the past week or so trying to find some way that I could just duplicate it and move forward but google analytics does not seem to allow that.
Thanks everybody have an awesome day.
If you need any help with setting up Google Analytics or developing a digital marketing strategy, please contact us today!